|
CANNA NEWS
STATE AND REGULATORY NEWS
House approves marijuana banking, employment and D.C. sales
provisions in large-scale spending bill. The U.S. House of Representatives
approved a package of spending legislation that contains measures to
provide protections for banks that work with state-legal cannabis
businesses and allow the legalization of marijuana sales in Washington,
D.C., among many other drug policy provisions. The appropriations
legislation and attached reports also direct federal government agencies to
reconsider policies that fire employees for using cannabis in compliance
with state law, criticize restrictive hemp regulations, encourage CBD to be
allowed in foods and urge expanded research on marijuana and other
substances. The legislation restricts the use of certain funds to punish
banks for working with marijuana businesses. Read More (Marijuana Moment)
Proposed tax rates in Schumer’s marijuana reform bill elicit
‘sticker shock’. The draft bill outlining Senate Majority Leader Chuck
Schumer’s federal marijuana reform legislation sets a nationwide MJ excise
tax that would rise from 10% to 25% over five years, a top rate that
industry officials argue would be overly burdensome to operators as well as
too high to combat illicit operators. The Cannabis Administration and
Opportunity Act – unveiled earlier as a 163-page “discussion draft” – would
legalize marijuana by removing it from the federal Controlled Substances
Act. That means it would eliminate Section 280E, the provision in the
Internal Revenue Service tax code that prevents marijuana businesses from
deducting the same ordinary business expenses that mainstream industries
can. But a 25% federal excise tax on marijuana – on top of any state and
local taxes – would hit growers especially hard, quite likely exceeding
their savings from the elimination of 280E, experts said. Read More (Marijuana Business Daily)
U.S. sports authority backs ‘liberalization’ of marijuana
laws, official tells lawmakers. A representative of the U.S.
Anti-Doping Agency (USADA) shifted blame for the Olympics suspension of the
U.S. runner Sha’Carri Richardson over a positive marijuana test, saying the
national sports organization is “heartbroken” over the case and supports
“liberalization” of current bans but claiming that its hands are tied with
respect to enforcing international drug policy. Justin Strekal, political
director for NORML, told Marijuana Moment: “USADA told Congress, right to
its face, that the policy of prohibition and stigmatization of cannabis
consumers is wrong. The remaining question is when will the House take
action to end the mandate that organizations like USADA, the DEA, ONDCP,
and others stop criminalizing otherwise law-abiding Americans?” Read More (Marijuana Moment)
How cannabis became illegal. It actually wasn't until 1970 that
cannabis, by virtue of being declared a Schedule l drug, officially became
illegal and of no medicinal value. In the 33 years between 1937 and 1970,
cannabis was not, technically, illegal. The Marijuana Tax Act of 1937 did,
however, make it illegal to produce, possess, or consume cannabis without
the permission of the federal government—as expressed in the form of a
special cannabis tax stamp. Interesting, the Marijuana Tax Act did not
explicitly outlaw cannabis. Rather, it failed to distribute the tax stamps
that legally permitted its cultivation and distribution, creating a de
facto prohibition at the federal level. In December 2018, a new Farm Bill
was passed by Congress which legalized hemp—although under relatively
strict regulatory oversight for which the traditionally anti-cannabis Drug
Enforcement Administration (DEA) plays a role in crafting and enforcing.
Read More (Higher Learning LV)
Does big business provide a better look into cannabis reform
than Capitol Hill? Operators believe so. Cannabis operators and executives tell
Benzinga that the movement of private and public companies may serve as a
better indicator of regulatory activity than the federal government. At the
very least, they say that the industry has made advancements so far without
the efforts of Capitol Hill. Poseidon Asset Management managing director
Emily Paxhia recently mentioned that she and her firm are tracking the
steps of private companies, cannabis and otherwise, noting which prominent
brands are supporting the cannabis industry. Operators in various sectors
of cannabis feel that the industry provides a better insight into
regulatory needs and movements than lawmakers. Read More (Markets Insider)
Billionaire Charles Koch on why cannabis should be legal. Depending on whom you ask,
Charles Koch is a titan of industry, dark money political bogeyman or the
Marcus Aurelius of the libertarian movement. But soon Koch might be known
as the billionaire who persuaded Republican and Democratic holdouts to
legalize cannabis at the federal level. Although Koch isn’t big on
consuming it himself, he’s going public now with a long-held belief:
Cannabis should be legal nationwide. So he’s putting his name, and nearly
$25 million of his $45 billion fortune, to influence criminal-justice
reform and legalization by the end of 2021. Charles Koch said:
“[Prohibition] is counterproductive. It ruins people’s lives, creates
conflict in society and is anti-progress. The whole thing never made sense
to me.” Read More (Forbes)
|
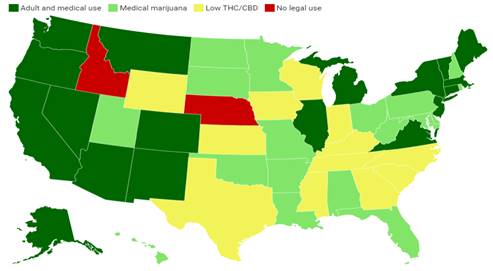
Chart 3: Cannabis Laws by State
|
|
|
Source: Intro-act, Will Yakowicz,
National Conference of State Legislatures and Marijuana Policy Project,
Datawrapper, Forbes
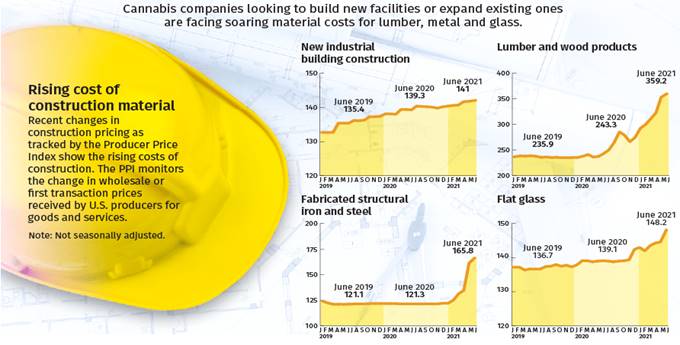
Cannabis firms face surging costs for building materials,
complicating plans. Cannabis growers, manufacturers and retailers planning to
build new facilities or expand existing ones are facing not only soaring
costs for materials but also lengthy wait times to get their projects off
the ground. And it’s not just the global COVID-19 pandemic that’s causing
the increased cost and supply shortage for both marijuana and mainstream
businesses, said David Fettner, principal of Highwood, Grow America
Builders, a construction company serving the cannabis industry. Wholesale
steel prices, for example, rose 36% during the first six months of the
year, according to federal data. Lumber prices in June were up 23% from
January and 48% from June 2020. Read More (Marijuana Business Daily)
|
Chart 4: Surging Construction Costs
|
|
|
Source: Intro-act, U.S. Bureau of Labor
Statistics’ Producer Price Index, Marijuana Business Daily
Ohio lawmakers introduce bill to legalize recreational
cannabis.
Two Democratic state lawmakers in Ohio introduced a bill to legalize
recreational cannabis. According to Toledo TV station WTVG, the measure
would establish a 10% excise tax on gross receipts of marijuana retailers. The
bill sponsors – state Reps. Casey Weinstein and Terrence Upchurch – said
they’re hopeful the measure will pass with bipartisan support. But at least
two Republican lawmakers told WTVG they’re staunchly opposed to legalizing
recreational marijuana. The move follows an announcement that a group of
cannabis advocates have launched a campaign to put adult-use cannabis on
Ohio’s 2022 ballot. Read More (Marijuana Business Daily)
Maryland plans recreational cannabis vote in 2022 elections. Marijuana is becoming a
fixture during political rallies, campaigns, and legislative plans. You
don’t have to wonder why this is the norm because there is a heightened
global interest in cannabis, with different states and nations committing
to studying and harnessing its potential through legalization. Maryland is
taking the same approach as its lawmakers are planning cannabis
legalization measures for their 2022 elections. The lawmakers announced
that the legislative arm of government would rely on voters on marijuana
policy reform. They intend to do this by putting cannabis legislation
measures on a statewide ballot in 2022. The Maryland House of Delegate
Speaker, Adrienne A. Jones issued a statement stating that she will create
a legislative workgroup to start studying the conditions around cannabis
legalization. Read More (Cannabis.net)
Illinois finally issues long overdue cannabis licenses. Governor J.B Pritzker’s
office announced the issuance of 200 new licenses for craft growers,
product manufacturers, and distributors that were originally to be issued
last year, according to Capitol News Illinois. The report stated that 67%
of the new licenses will go to people of color, helping fulfill part of the
social equity program first proposed in the state’s adult-use legalization
measure, which was passed into law in 2019. Additionally, Pritzker signed into
law Illinois House Bill 1443, which establishes three lotteries for
retailer licenses. The first is essentially a do-over of one conducted last
year, the 75 retailer licenses from which were never issued due to
litigation over the license-scoring process. Two additional lotteries will
award 55 retailer licenses each. Read More (Cannabis Benchmarks) and More (Grown In) and More (Marijuana Business Daily)
Idaho officials clear marijuana activists to collect
signatures for revised legalization ballot measure. Idaho officials have
cleared activists to begin collecting signatures for a revised initiative
to legalize possession of marijuana that they hope to place before voters
on the 2022 ballot. After being reviewed by the state attorney general’s
office, the latest version of the measure was uploaded to the secretary of
state’s website in final form along with official short and long ballot
titles. Meanwhile, a separate campaign to legalize medical cannabis in the
state is also underway, with advocates actively collecting signatures to
qualify that measure for next year’s ballot. The attorney general
previously outlined a number concerns on potential legal issues with the
adult-use measure and made non-binding recommendations for changes. Read More (Marijuana Moment)
Cuomo’s slow rollout of legalized weed becoming a real
buzzkill, critics say. New York’s legalized-pot program is on a train to nowhere —
apparently derailed because Gov. Andrew Cuomo is fuming over his stalled
plans to overhaul leadership at the MTA. Cuomo and the state legislature
approved the legalized sale of weed in New York in March, but the governor
has since become a real buzzkill on the issue, critics say. He has yet to
nominate an executive director for his new Office of Cannabis Management or
name appointees to the Cannabis Control Board, even though the Marijuana
Taxation and Regulation Act was passed months ago. Cuomo spokesman Richard
Azzopardi said: “We agree there’s a lot of unfinished business with the
Senate, and we’re ready to submit our nominations, and we hope they
reconvene and act on these and our MTA legislation and nominations.” Read More (New York Post)
Illegal cannabis growers are stealing water amid California’s
drought, officials say. California’s deepening drought is creating another big problem
for authorities: water theft. Water thieves, many of them illegal marijuana
growers, are tapping into fire hydrants and drilling unauthorized water
wells, according to officials, threatening the water supply for residents.
In a recent sting in Antelope Valley in northern Los Angeles County,
federal, state and local law enforcement officers disrupted hundreds of
allegedly illegal marijuana cultivations in the area. They arrested 131
people and seized 65 vehicles, including two water trucks. Authorities
recovered $28,000, 33,480 pounds of marijuana and dozens of firearms.
Nineteen people were charged with water theft. Water thieves, many of them
illegal marijuana growers, are tapping into fire hydrants and drilling
unauthorized water wells, according to officials, threatening the water
supply for residents. Read More (The Washington Post)
Cannabis industry in New Mexico faces big water challenge. All prospective cannabis
producers in New Mexico must prove they have rights to water and an
adequate supply before they can apply for a license, the Santa Fe New
Mexican reported. That can be a problem, especially for rural growers, in a
state with complicated laws divvying up a limited supply of water rights
and in the throes of a 20-year megadrought that threatens to contribute to
a serious water shortage. While cannabis growers who plan to operate in
facilities within a city can tap into the municipal water supply as
commercial customers, those growing outside city limits must purchase or
lease commercial or agricultural water rights from someone else who owns
them — a difficult and time-consuming process. A domestic well on private
property does not satisfy the requirement. Read More (Antelope Valley Press)
New Mexico likely to run out of cannabis after legal sales
begin. The
head of the state agency charged with overseeing New Mexico's upcoming
recreational cannabis industry told lawmakers to prepare for the
"Krispy Kreme syndrome." Linda Trujillo, superintendent of the
Regulation and Licensing Department, said: "It's highly likely we will
run out of cannabis in the first week, if not the first two weeks"
after legal sales begin. Comparing expectations of the new market, expected
to start by April, to reports of people waiting in line for hours before
the opening of a new Krispy Kreme franchise, Trujillo said the initial
demand will diminish over time. The Regulation and Licensing Department has
not yet released proposed rules for retailers, and its Cannabis Control
Division has not yet completed appointments to the Cannabis Regulation
Advisory Committee, which is tasked with providing guidance on the
industry's rules. Read More (The Santa Fe New Mexican)
Michigan credit union to offer banking services to marijuana
companies. The
Frankenmuth Credit Union in Michigan launched a product to provide banking
to marijuana companies in the area, only months after regulators went after
another financial institution for a similar move. According to the Detroit
Metro Times, the credit union created Envy, a pilot program dedicated to
servicing cannabis businesses and unveiled a plan to add one or two new
marijuana-related business members each month for the remainder of 2021.
The credit union, which services roughly 60,000 people, is partnering with
Green Check Verified, a financial technology company that enables financial
institutions to “safely and efficiently” offer services to legal marijuana
businesses. Read More (Marijuana Business Daily)
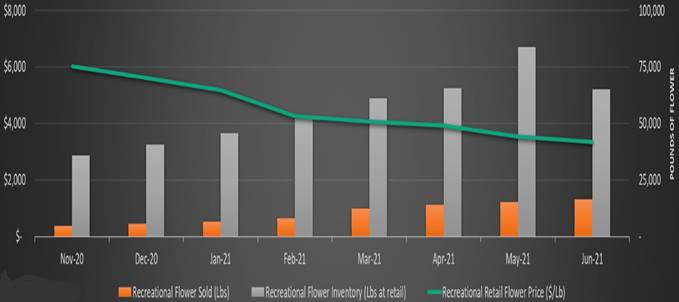
Michigan is the state of opportunity for private marijuana
operators. Despite
being a top cannabis market in the U.S., Michigan largely has been ignored
by multistate operators because of the low barriers to entry for new
licensees. However, with plenty of market growth and heavy fragmentation
across the supply chain, the state offers a compelling opportunity for
efficient private operators. The fragmentation, in turn, has caused price
compression. Initially, this was offset by consumer demand, with
recreational sales per dispensary peaking at $5 million in April 2021.
However, demand has slowed in recent months, and prices have continued
their decline. This highly competitive environment has kept most publicly
traded companies away from Michigan. Read More (Marijuana Business Daily)
|
Chart 5: Michigan Retail Flower Price Versus
Quantity Sold and Inventoried
|
|
|
Source: Intro-act, MjResearchCo,
Marijuana Business Daily
Colorado launches Cannabis Business Office to assist MJ
companies. Colorado
is forming a new state agency, the Cannabis Business Office, designed to
provide more governmental support to marijuana companies, particularly
social equity entrepreneurs. The new department, announced by Colorado Gov.
Jared Polis, will dole out loans and grants to social equity cannabis
entrepreneurs and provide technical assistance to MJ business owners. The
Cannabis Business Office will be an arm of the Colorado Office of Economic
Development and International Trade. The agency was created just this year
by the Colorado legislature with the passage of Senate Bill 111. In a
statement, Polis said the creation of the department is part of his overall
goal of making Colorado a national cannabis industry leader. Read More (Marijuana Business Daily)
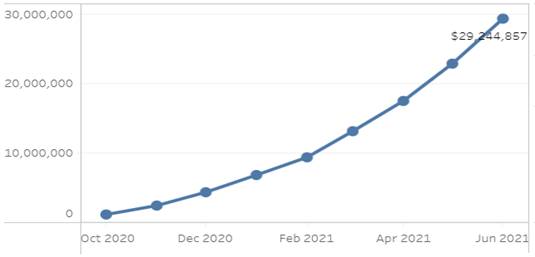
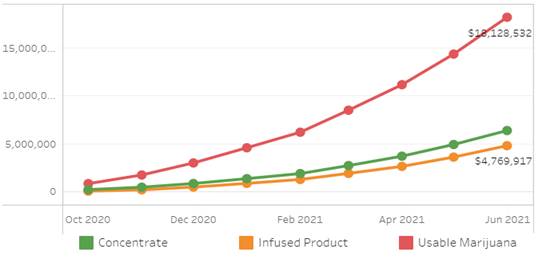
Maine’s recreational marijuana industry saw record $6.4
million sales in June. Maine’s adult-use marijuana industry had another
record-breaking month in June, with nearly $6.5 million sold in June. From
first-timers to regular customers, there’s growing demand for marijuana in
Maine. Statewide, retail sales reached $6.47 million in June, up more than
a million dollars from May. Erik Gundersen, director of the Maine Office of
Marijuana Policy said: “Taking a look at some early data, we expect the
same thing for July, so it’s incredibly encouraging. Consumers are starting
to choose the regulated, tested, tracked marketplace for cannabis”. He said
access is expanding, with 45 active retail stores and around 50
municipalities opting-in. Read More (Bangor Daily News) and More (Maine.gov)
|
Chart 6: Sales Amount
|
|
|
|
Chart 7: Sales Amount – By Product Category
|
|
|
Source: Intro-act, Maine.gov
Medical marijuana sales in Arkansas hit $365 million, state
officials expect tallies to top $400 million by fall. Medical marijuana sales
keep climbing in Arkansas, and state officials expect the figures to keep
getting higher. New figures released from the Arkansas Department of
Finance and Administration show the state hitting $365 million in overall
sales from 54,009 pounds of product. Those numbers are an increase of $26.5
million and 3,924 pounds since June’s data, which reported $338.5 million
and 50,085 pounds in sales. As of July 23, there are 78,754 active patient
cards in the state. That’s a 1,081 increase over the 77,673 reported in
June. That increase in patients and dispensaries has state officials
predicting continued growth in state revenue from medical marijuana in the
Natural State. DFA spokesperson Scott Hardin said: “We anticipate sales
will reach $400 million by September 1”. Read More (KARK.com)
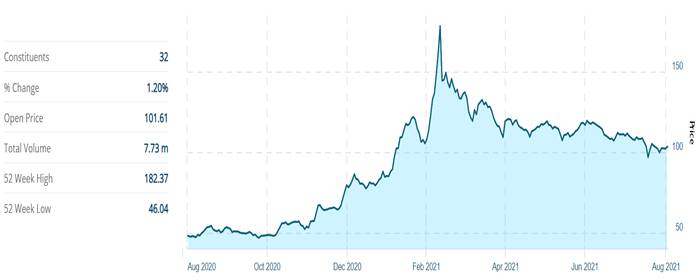
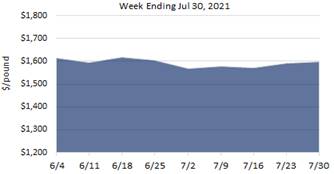
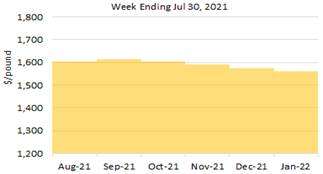
The U.S. cannabis spot index increased 0.5% to $1,598 per
pound, August 2021 implied forward down $10 to close at $1,605 per pound. The simple average
(non-volume weighted) price increased $27 to $1,881 per pound, with 68% of
transactions (one standard deviation) in the $1,063 to $2,699 per pound
range. The average reported deal size increased to 2.6 pounds. In grams,
the Spot price was $3.52 and the simple average price was $4.15. The
average reported forward deal size was 62.5 pounds. The proportions of
forward deals for outdoor, greenhouse, and indoor-grown flower were 53%,
35%, and 11% of forward arrangements, respectively. The average forward
deal sizes for monthly delivery for outdoor, greenhouse, and indoor-grown
flower were 78 pounds, 50 pounds, and 30 pounds, respectively. Read More (Cannabis Benchmarks)
|
Chart 8: Cannabis Benchmarks U.S. Spot Index
|
Chart 9: Cannabis Benchmarks U.S. Implied
Forward Curve
|
|
|
|
Source: Intro-act, Cannabis Benchmarks, New
Leaf Data Services
Legal cannabis industry in Oklahoma funds more enforcement
efforts as criminals 'make us look bad'. With a more open cannabis industry in
Oklahoma spurring organized crime concerns, state agencies say they need to
team up and expand compliance and enforcement efforts with funding provided
from the fees paid by medical marijuana businesses operating legally. An
Oklahoma Medical Marijuana Authority-licensed Garvin County grower told the
Tulsa World: “We need to make sure bad actors are not here. For those of us
who live and breathe these rules every day, it makes us look bad.”
Officials with OMMA and the Oklahoma Bureau of Narcotics are hopeful a new
memorandum of understanding between the two organizations, despite their
differing roles, will improve efforts to efficiently block illicit activity
— whether from within the state’s medical program or otherwise. Read More (Tulsa World)
Elon Musk, Jeff Bezos & Richard
Branson: which market leaders will make up the cannabis industry space
race? As
billionaires like Elon Musk, Jeff Bezos and Richard Branson race for space,
who will be the leaders in the nascent cannabis industry as it vaults to
astronomical heights? Operators in various parts of the cannabis industry
offered Benzinga their takes. Providing various responses, most focused
less on the people and more so the brands and companies that could be
headed to the moon, of sorts. Olivia Alexander, CEO of online global CBD
boutique Kush Queen, compared the industry to the dot com bubble and said:
"At this stage, the industry is so young with so much room for
innovation and expansion it is very hard to say how many players are going
to remain once the market begins to mature and fully develop on a federal
level." Read More (Markets Insider)
Canadian cannabis producers have sold less than 20% of output
since adult-use legalization. Cannabis producers in Canada have sold less than 20% of
their production since the country launched adult-use sales in October
2018, according to an MJBizDaily analysis. The newest data – which runs
through 2020 – implies that most of the cannabis produced from 2018 through
last year was either stored in inventory or destroyed, and less than
one-fifth ended up in retail stores. That disconnect likely helps explain how
the largest Canadian cannabis producers, which account for most of the
industry’s production, together have lost more than CAD $11 billion ($8.8
billion) cumulatively. Roughly 2.7 billion grams (2,976 tons) of cannabis
were produced in Canada between October 2018 and December 2020, but
MJBizDaily estimates that approximately 450 million grams reached store
shelves. Read More (Marijuana Business Daily)
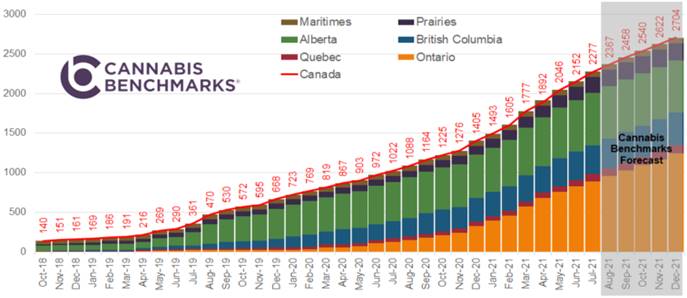
Cannabis stores on rise in Canada. The number of stores
continues to climb steadily across the country, making the legal cannabis
system more accessible to consumers. Our latest count shows the number of
stores open for business reached 2,277 as of the end of July. This is up by
1,255 stores, or a jump of 123%, compared to July 2020. As can be seen in
the chart below, Cannabis Benchmarks expect that trend to continue
throughout this year. Cannabis Benchmarks expected Alberta’s store count to
plateau in the second quarter of this year, but the store count there has
continued to grow. Quebec currently has 89 cannabis retail locations, which
is a 106% increase from last year, and we expect the store count there will
expand to 104 retail locations by the end of the year. Read More (Cannabis Benchmarks)
|
Chart 10: Cannabis Retail Store Count by
Province
|
|
|
Source: Intro-act, Cannabis Benchmarks,
New Leaf Data Services
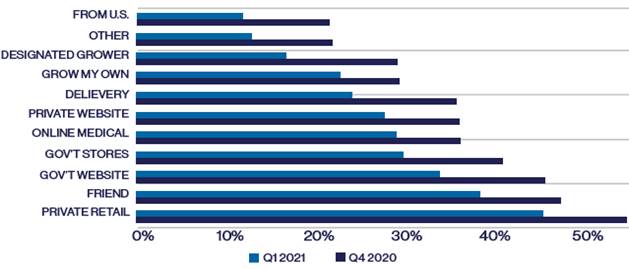
Older, higher and fewer newbies: four new trends in Canada's
cannabis market. 1) More older users: While there was a presumption during the
early days of legalization that older Canadians were a mostly
"canna-curious" group, and that most sales would occur from a
younger demographic, Brightfield found that the average consumer age has
increased over the past year, 2) High demand for high THC: Canadian
cannabis users who prefer their products with THC were found to be the most
frequent consumers, with 48 percent of those so-called "THC-dominant
consumers" using marijuana at least once daily, while 28 percent of
them said they consume multiple times a day, 3) Fewer newbies: The amount
of new people entering the cannabis market is trending down, a sign that
the total consumer base may be plateauing in the Canadian market, and 4)
Illicit market shift: Ontario cannabis consumers are increasingly moving
away from the illicit market and engaging more with legal retail options as
they become more widely available and convenient, according to
Brightfield's data. Read More (BNN Bloomberg)
|
Chart 11: Shifting Sources: Where Canadians Buy
Their Cannabis
|
|
|
Source: Intro-act, Brightfield Group,
BNN Bloomberg
COVID-19
COVID cannabis consumption expected to remain high even after
pandemic. Cannabis
producers in Canada have sold less than 20% of their production since the
country launched adult-use sales in October 2018, according to an
MJBizDaily analysis. The newest data – which runs through 2020 – implies
that most of the cannabis produced from 2018 through last year was either
stored in inventory or destroyed, and less than one-fifth ended up in
retail stores. That disconnect likely helps explain how the largest
Canadian cannabis producers, which account for most of the industry’s
production, together have lost more than CAD $11 billion ($8.8 billion)
cumulatively. Some industry experts blame poor-quality cannabis for the
sales shortfall. Read More (Marijuana Business Daily)
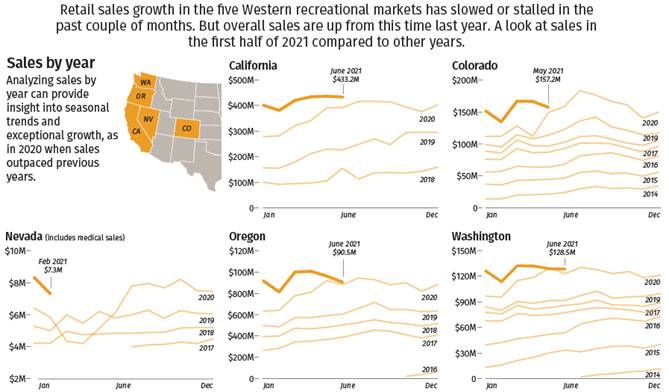
Boom or bust? Marijuana execs see more sales gains as COVID-19
lockdowns ease. While marijuana sales have slowed the past couple of months –
raising questions about whether a boom in coronavirus-related cannabis
purchases is petering out – industry executives are bullish and note that
sales remain up versus a year ago. And while recreational sales in some key
states have begun to show signs of flattening, they remain above levels
seen a year ago, according to Seattle-based data-analytics firm Headset. In
California, for example, adult-use sales in June eased 0.8% from May but
were up 10.4% versus June of last year. Ditto in Oregon, where sales in
June were off 6% from May but up 2.4% from a year earlier. And in
Washington state, June sales were off 0.3% from May but up 4.5% from a year
earlier. Read More (Marijuana Business Daily)
|
Chart 12: Adult-Use Sales Soften but Up
Year-Over-Year
|
|
|
Source: Intro-act, State Marijuana
Regulatory Agencies, Headset
COMPANY NEWS
Tilray reports $336 million annual loss, targets $4 billion in
cannabis sales by 2024. Tilray (TLRY) reported an annual loss of $336
million (CAD $422 million) for its fiscal year ended May 31, capping off a
transformative year in which the company closed a reverse-merger with
Aphria and bought U.S SweetWater Brewing Co. On a quarterly basis, net
revenue increased 16% over the previous three-month period to $142 million,
helping the company post net income of $33.6 million while adjusted EBITDA
was $12.3 million. In a conference call with analysts to discuss the
quarter, CEO Irwin Simon said Tilray is aiming to achieve $4 billion in
sales by the end of 2024. He said the forecast includes expected sales in
the U.S. of up to $1.5 billion. Read More (Marijuana Business Daily)
Tilray CEO breaks down the future of the cannabis industry. Tilray (TLRY) CEO Irwin Simon talks with Julie
Hyman on the integration of Tilray and Aphria thus far, and his vision for
the company and cannabis industry heading into a post-pandemic world He
said: “When you think of cannabis, you think adult use, and what it
ultimately does from relaxation from giving you a little energy high, et
cetera, and cannabis, also, used in lots of different medical formats and
medical reasons.” He added: “You know, the natural organic food industry
was about a $60 billion industry, so the cannabis industry is a much bigger
industry, a much bigger opportunity. My playbook here is to create the
largest cannabis company that's built around consumer brands, and those
brands will be built around adult use. It will be built around medical
cannabis. It will be built around drinks, edibles, and food.” Read More (Yahoo!)
Houseplant and Canopy Growth to conclude their strategic
relationship in Canada. After three years of a successful joint venture, Houseplant
and Canopy Growth (CGC) have mutually agreed to
end their relationship. The Canadian cannabis market has evolved
substantially during this period, and the parties believe the time is right
for the Houseplant brand to develop independently while Canopy advances its
focus on wholly-owned brands for the Canadian market. The relationship
between Houseplant and Canopy started in 2018, well ahead of Canadian
legalization. Since that time, Houseplant and Canopy worked together to
pave the way in defining a premium cannabis experience in a new market.
During the course of their relationship, Houseplant has become a popular
consumer brand in Canada and is currently a top 10 brand in the premium
cannabis market in Ontario. Read More (Newswire)
Aurora Cannabis continues board revamp, installs ex-Pfizer
executive.
Aurora Cannabis (ACB) expanded its board and
installed Theresa Firestone, a senior health-care executive, as an
independent director. Firestone joins Aurora after overseeing the launch of
Shoppers Drug Mart’s medical cannabis business. Shoppers, owned by
supermarket giant Loblaw Cos., is the largest pharmacy chain in Canada.
Previous to Shoppers, Firestone held senior roles at pharmaceutical and
biotechnology firm Pfizer, including acting as regional president, Asia,
according to her LinkedIn profile. Aurora chair Ronald Funk said in a
statement that Firestone “brings to us extensive expertise in healthcare
management and pharmaceuticals, global business restructuring, new business
development and a proven ability to lead and manage change”. Read More (Marijuana Business Daily)
GrowGeneration signs asset purchase agreement to acquire chain
of hydroponic garden centers. GrowGeneration (GRWG) entered an asset purchase
agreement to acquire HGS Hydro, the nation's third-largest chain of
hydroponic garden centers, with six stores across Michigan and a seventh
store slated to open in the fall of 2021. This transaction is expected to
close before the end of fiscal year-end 2021. Founded in 2015 by Rocky
Shaeena, HGS Hydro is the largest chain of hydroponic garden centers in the
state of Michigan and generated approximately $50 million in revenue in
2020. When completed, the transaction will also bring the total number of
GrowGen hydroponic garden centers in Michigan to 14 and the total number of
stores to 65. Read More (GrowGeneration)
Clever Leaves and Biopharmaceutical Research Company to
partner for landmark cannabis research study. Clever Leaves Holdings
Biopharmaceutical Research Company announced a joint partnership with the
intent to study the DNA sequence variation of three Clever Leaves’ cannabis
cultivars as part of their Project Change Lives campaign. Project Change
Lives is the U.S.-based initiative sponsored by Clever Leaves, whereby the
company has pledged to contribute up to $25,000,000 retail value of medical
cannabis products to any eligible U.S. organization to help advance
scientific research into the potential medical benefits of cannabinoids. By
sponsoring Project Change Lives, Clever Leaves is offering to provide a
historic amount of pharmaceutical-grade cannabis to leading research
institutions in one of the most advanced pharmaceutical markets in the
world. Read More (Yahoo!)
Verano to expand Nevada presence with $29 million acquisition
of Sierra Well. Verano Holdings entered into an agreement to acquire all of
the equity interests of WSCC, Inc., d/b/a Sierra Well, adding two
operational dispensaries and an active cultivation and production facility
in Nevada along with two real estate properties in Carson City and Reno.
Both dispensaries are situated along busy retail corridors and just minutes
from their respective city centers. Closing on the transaction is subject
to customary conditions, contingencies, and approvals, including regulatory
approval. The transaction is expected to strengthen distribution capability
in Northern Nevada with the addition of an approximately 10,000 sq. ft.
Reno cultivation and production facility, complementing active expansion at
the Verano-affiliated cultivation facility in North Las Vegas. Read More (New Cannabis Ventures)
Harvest One eyes global expansion for new cannabis-infused
products.
With its 2018 acquisition of Dream Water, Harvest One (HRVOF) gained instant access to
30,000 North American retail outlets and an emerging e-commerce business.
The brand already had gained considerable recognition by the time Harvest
One acquired it and since then, Dream Water has added more than 11,000 new
distribution points across the U.S. In February, the company signed a major
Asian distribution agreement, gaining access to Golden River’s massive
distribution network that includes retail partners across China and other
Asian countries, e-commerce platforms with a total of over 500 million
active monthly users and airlines. With its expanding portfolio of
cannabis-infused topical creams and its plan to develop other innovative
products that aid in sleep and relaxation under its acquired Dream Water
brand, Harvest One demonstrates a strategy aimed at those exact consumer
demands. Read More (Benzinga)
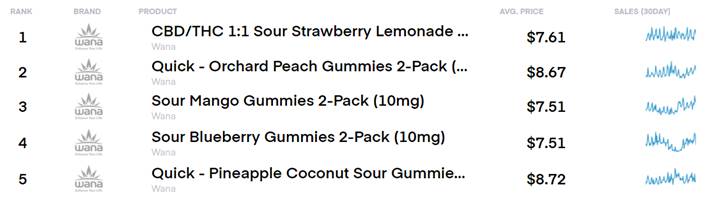
Bootstrapped edibles company Wana Brands on track to double
markets served by year-end. Wana Brands which is currently in 11 states in the
U.S., soon to be 12. The company is launching in Massachusetts in early
September, according to co-founder and CEO Nancy Whiteman. With more
agreements either signed or close to being signed, the company will be in
16 states by the end of the year or early 2022. In addition to its U.S.
footprint, Wana has market reach in Canada through its manufacturing
partnership with Indiva (NDVAF). Wana has approximately 45% market
share in the gummy space in Canada. Through that partnership, Wana has been
able to bring its U.S. products to the Canadian market, and it will be
looking to introduce more innovative products to Canada over the next six
to eight months. Read More (New Cannabis Ventures)
Lowell Farms looks to leverage its brand power in California
and beyond following transformative M&A. Lowell Farms has a widespread
distribution reach in California, reaching up to Tahoe and Mammoth and down
to San Diego. The company operates 15 routes per day, some running five
days a week and others once a week. In total, Lowell Farms serves about 85
percent of licensed retailers in the state, according to Lowell Farms CEO
Mark Ainsworth. The company is also preparing now for the eventuality of
federal legalization and cross-border transactions. Lowell Farms has made
acquisitions and infrastructure decisions that will help it be ready for
that future, rather than waiting and being months behind other operators.
The company is taking its Lowell Smokes brand to Illinois and Massachusetts
through a licensing agreement with Ascend Wellness Holdings. Read More (New Cannabis Ventures)
Marijuana industry veteran Kris Krane leaving 4Front Ventures.
Kris
Krane, co-founder of 4Front Ventures (CNXXF) and president of Mission
Dispensaries, is stepping down after nearly 11 years with the Arizona-based
multistate operator. The transition was months in the making, according to
a news release, with Krane staying on as strategic adviser. 4Front doesn’t
plan to immediately fill Krane’s post as president of Mission Dispensaries.
Krane said in the release: “In the last 11 years, we went from a few people
in a room with an idea, to building a national, vertically integrated
cannabis operator with operations and facilities in strategic medical and
adult-use cannabis markets, including California, Illinois, Massachusetts,
Michigan and Washington.” He further continued: “I feel incredibly
fortunate to have played an instrumental role in 4Front’s journey.” Read More (Marijuana Business Daily)
Kanabo to be Europe's biggest public cannabis business after
takeover. Kanabo
said that it had agreed terms to buy the European operations of Materia.
Exact terms weren't disclosed but Kanabo said the deal would be paid for
through shares and subject to performance-related goals. Materia owns a
cannabis processing plant in Malta and a wholesaling business in Germany,
which is the largest market for legal marijuana in Europe. Materia's Malta
plant has contracts with around 20 producers globally and is currently
vetting them. In a statement to the stock market, Kanabo's chief executive
Avihu Tamir said: "Together with Kanabo's R&D and commercialization
capabilities, I expect this enlarged group to become the biggest public
cannabis company in the UK and EU and puts us in a unique position as the
multibillion pound medicinal cannabis market begins to grow in
Europe." Read More (Yahoo)
Flora Growth to partner with Avaria to distribute
award-winning pain cream brand KaLaya. Flora Growth has signed a non-binding
Letter of Intent to form a joint venture with Avaria, the manufacturer and
owner of KaLaya – an award-winning pain cream distributed nation-wide
across Canada. Through the JV, Flora Growth will manage registration,
sales, and distribution of KaLaya products in Colombia, Mexico, and other
LATAM countries, while Avaria will supply finished product to the JV.
Further, Flora Lab will work to produce KaLaya’s CBD-infused products using
cannabis from Flora’s cultivation facility. These products are expected to
be distributed across LATAM using Flora Lab’s established distribution
channels, with the aim of exporting to the U.S. market, where Avaria is
currently launching the KaLaya brand. Read More (Technical420)
IM Cannabis expands position in Israel with $4.6 million
acquisition. On July 28, 2021, IMC Holdings concurrently executed
definitive share purchase agreements to acquire all of the outstanding
ordinary shares of each of: 1) Pharm Yarok, a leading medical cannabis
pharmacy located in central Israel, 2) Rosen High Way, a trade and
distribution center providing medical cannabis storage, distribution
services and logistics solutions for cannabis companies and pharmacies in
Israel, and 3) HW Shinua, an applicant for a medical cannabis
transportation license from the Israeli Medical Cannabis Unit. The
aggregate consideration for the Acquisition is approximately $4.6 million1
in cash, of which $1.3 million shall be invested in IMC in consideration
for IMC’s equity by the shareholders of Pharm Yarok, Rosen High Way and HW
Shinua. Read More (New Cannabis Ventures)
Pure Extracts receives sales license from Health Canada. Pure Extracts Technologies
announced that its wholly owned subsidiary, Pure Extracts Manufacturing,
has received approval from Health Canada to amend its license to permit the
sale of cannabis extract products to provincially authorized distributors
and retailers nationwide as well as to holders of licenses for the sale of
medical cannabis extracts. This approval is the result of an intensive
review by Health Canada of Pure Extracts’ internal systems, processes,
products and packaging. The company’s purchase orders from British
Columbia, Alberta, Saskatchewan and Ontario are currently being fulfilled
by its distribution partner, thus having its own sales license will allow
Pure Extracts’ products to eventually reach all provincial and territorial
jurisdictions across Canada without the help of an intermediary. Read More (GlobeNewswire)
Cannabis companies looking to grow have more options than
ever. Josh
Genderson, CEO of Holistic Industries, which operates in six states plus
Washington DC didn’t plan to take his medical marijuana business national,
but his first success highlighted the opportunities that awaited. Genderson
scaled Holistic Industries by winning licenses in limited markets and
establishing regional presence to build brand recognition. Success bred
capital raises that have allowed Holistic to add M&A to its scaling
toolbox, but securing licenses remains central to its strategy. Adam Berk,
the founder of food-delivery service company Osmio, which became Grubhub,
focused on establishing brands, proving them in a tough market and then
taking them into other states through M&As. The arrival of COVID-19
compelled Berk to update his strategy. Read More (Marijuana Business Daily)
Cannabis pharmaceuticals are hopeful as senate drafts bill to
legalize marijuana. As U.S. Senate leaders discuss a draft of a bill to legalize
marijuana on a federal level, giants in the cannabis industry are preparing
for what could be coming next. If passed, the Cannabis Administration and
Opportunity Act would remove marijuana from the Controlled Substances Act,
expunge federal convictions for nonviolent marijuana offenses and establish
a way to tax marijuana. It would also give cannabis pharmaceutical companies,
like the Tilray (TLRY), a chance to shine in the U.S. Tilray
CEO Irwin Simon told Yahoo Finance: “I see over the next 18-to-24 months
that cannabis in some format will have legalization.” Read More (International Business Times)
EARNINGS
Greenlane pre-announces Q2 revenue at $34.5 million. Greenlane Holdings (GNLN) announced preliminary
financial results for its second quarter ended June 30, 2021 with estimated
net sales of approximately $34.5 million. The company also anticipates gross
margin of 21% to 22% and total cash balance of approximately $11.5 million.
Primarily due to headwinds created by uncertainty in supply chain and
lingering impacts of Covid-19, the company suspended its illustrative pro
forma outlook provided on March 31, 2021, for the calendar year ending
December 31, 2021, and expects to reestablish a pro forma outlook at a
later date. Greenlane continues to expect the proposed merger with KushCo Holdings (KSHB) to close in the third
quarter of 2021, subject to the satisfaction or waiver of all remaining
conditions in the agreement, including the receipt of all necessary
approvals.” Read More (New Cannabis Ventures)
CAPITAL MARKETS
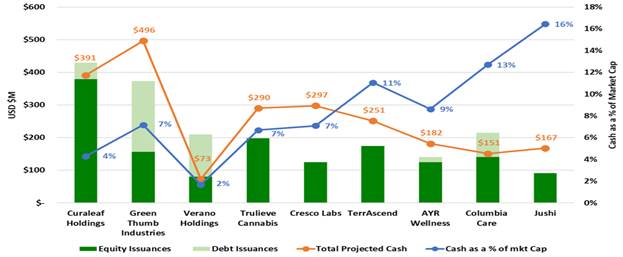
Projected June cash levels are high suggesting continuing
M&A acceleration. It’s no secret that 2021 has been a record year for the U.S.
Cannabis M&A activity and a robust year for the U.S. cannabis capital
raises. The graph shows YTD equity raises (dark green bar) and debt capital
raises (light green bar) for nine of the largest MSOs. The orange line on
the graph shows projected June cash balances. Viridian started with beginning
of the year cash, added capital raises, subtracted the cash component of
both closed and pending acquisitions and added actual free cash flow for Q1
and projected free cash flow for Q2. The blue line shows projected mid-year
cash balances as a percentage of market cap. High cash levels and
relative cash levels suggest continued strong M&A and capital spending
levels for the remainder of 2021 and beyond. Read More (Viridian Capital Advisors)
|
Chart 13: Capital Raises Provide Fuel for
Continued Acquisitions
|
|
|
Source: Intro-act, Viridian Capital
Advisors
Schumer's pot legislation could spark up cannabis IPOs on Wall
Street. A
bill introduced by Senate majority leader Chuck Schumer would remove
cannabis from the Controlled Substances Act, a process known as
descheduling. In doing so, lawmakers would open the door to a host of
financial services long denied to the industry. Banks and other financial
institutions—including stock exchanges—avoid doing business with the U.S.
marijuana companies in large part because of federal anti-money laundering
laws that criminalize financial transactions tied to illegal activity. But
a legislative overhaul may help pot companies to go public in the U.S.,
either by giving banks leeway or changing the drug's legal status. That
could set up a crucial exit option for privately backed cannabis companies,
ending the need for workarounds like listing shares in Canada or banking
with state-chartered credit unions. Read More (PitchBook)
MEDICAL CANNABIS
Congressional lawmakers push marijuana protections for all
states. An
amendment to protect all state and tribal marijuana programs from federal
interference now has 15 cosponsors after its bipartisan proponents
circulated a letter to build support. But a Republican opponent of reform
is pushing a dueling proposal to end a more modest, longstanding rider
that’s provided protections for medical cannabis states alone. Meanwhile,
Rep. Doug LaMalfa (R-CA) is taking the unusual step of filing a competing
measure that would cease federal protections for states with medical
cannabis legalization on the books—including his own—that have been in
place and renewed annually on a bipartisan basis since 2014. Read More (Marijuana Moment)
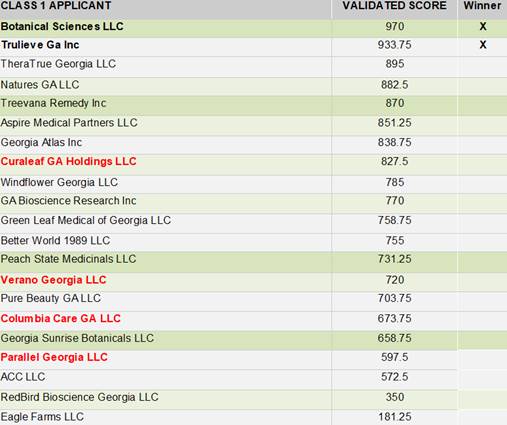
Georgia announces winners of six medical marijuana licenses. At long last the Georgia
Access to Medical Marijuana Commission chose six companies that will be
allowed to grow, manufacture and sell medical marijuana oil capped at 5%
THC. Each license holder will be allowed to open five dispensaries.
Botanical Sciences and Trulieve GA (TCNNF) won Class 1 Production
Licenses which allows for up to 100,000 square feet of cultivation space.
FFD GA Holdings (Fine Fettle Dispensary), Theratrue Georgia, Natures GA and
Treevana Remedy were awarded a Class2 License which permits them to
cultivate cannabis with 50,000 square feet of canopy. Read More (Cannabiz media) and More (Marijuana Business Daily)
|
Chart 14: List of Applicants with Validated
Score
|
|
|
Source: Intro-act, Cannabiz Media
License Database, Cannabiz Media
Public backs medical marijuana, South Carolina polls suggest.
Is that enough to convince lawmakers? Next year, South Carolina lawmakers
will debate and possibly vote to join nearly 40 states that legalize some
sort of medical marijuana. In this case, for use in oils and creams
prescribed by licensed doctors for people with some of the most-serious and
debilitating diseases and health problems. The state’s survey of South
Carolina’s 46 state senators found a majority, if not all, senators want to
have the debate. Yet, in addition to the bill’s 16 sponsors, three said
they were supportive or leaning toward voting for it. Eleven said they were
still studying the bill or hadn’t decided, while some of them acknowledged
the public support and the health benefits but wanted to see changes. Five
said they were likely to vote against and one declined to comment. Read More (Johnson City Press)
Mississippi lawmakers drafting medical marijuana measure. A Mississippi Senate
committee is close to finishing draft legislation to legalize medical
marijuana, two months after the state’s highest court struck down a
voter-approved, business-friendly bill, Lt. Gov. Delbert Hosemann said. The
development leaves open the possibility that Gov. Tate Reeves could call a
special session later this summer to address the issue, according to
WAPT-TV in Jackson and other media. The governor might feel pressure to do
so after voters in the Deep South state approved MMJ legalization by an
overwhelming margin at the ballot box in November. The measure, however,
isn’t expected to be nearly as pro-business as the voter-approved version.
Full details of the potential Senate bill weren’t disclosed. Read More (Marijuana Business Daily)
CBD/HEMP
Cannabis Administration And Opportunity Act: what the proposed
federal cannabis laws would mean for hemp. Senators Chuck Schumer (D-NY), Ron
Wyden (D-OR), and Cory Booker (D-NJ) released the discussion draft of
historic federal cannabis legalization legislation, the Cannabis
Administration and Opportunity Act (CAOA). The CAOA would not only end
cannabis prohibition but would also establish a regulatory framework for
cannabis under the U.S. Food and Drug Administration (FDA) and the Alcohol
and Tobacco Tax and Trade Bureau (TTB). It also includes comprehensive
restorative justice provisions, including grants, loans, and other funding
programs for disadvantaged and minority businesses, record expungement,
petitions for resentencing, and other measures intended to repair the
decades of harm caused by the War on Drugs. Read More (JD Supra)
Market participants report increased CBD sales on demand for
delta-8 THC, but prices continue to slide. July month saw continued
erosion in wholesale hemp cannabinoid product prices for the most part.
Crude CBD Oil and Broad Spectrum CBD Distillate were the only extracted
hemp cannabinoid products to see price rises in July, but rates for each
remain well below those observed just a few months ago. Observed rates for
Delta-8 THC distillate have also resumed a downward trend in the face of
consistent demand. July month’s observed average per-kilogram price was
down 12% from June. Individual transactions ranged from $800 per kilogram
to $1,600 per kilogram, with both the low and high ends of the range down
from last month. Read More (Hemp Benchmarks)
|
Chart 15: July 2021 Spot Price Index Report
|
|
|
Source: Intro-act, New Leaf Data
Services, Hemp Benchmarks
CBD industry needs regulation to bring legitimacy. When it comes to CBD,
entrepreneurs would be well served to start with the end in mind. The
foreseeable outcome is federal regulation – just like any other consumed
food or dietary supplement on the market. While it is understandable that
CBD manufacturers would prefer to run their businesses without any
government intervention, being left unchecked has made the sector
vulnerable to unscrupulous behavior. Without regulation in place, anyone
can sell CBD products. If regulatory history has taught us anything, it is
that when it comes to problems with health and wellness supplements,
regulation often stimulates improvements in public health. In addition,
regulation brings legitimacy to the industry, which is just what the
industry needs to spur the next big surge of confidence in CBD. Read More (Hemp Industry Daily)
Here’s how Delta-8’s popularity is dividing NC’s fledgling
hemp industry. One of the hottest new cannabinoids on the market is dividing
North Carolina’s fledgling hemp industry. Enter Delta-8 THC, otherwise
known as “Weed’s Little Brother.” It’s the less-potent, less well-known
cousin of Delta-9 THC, the chief psychoactive compound in marijuana, and
it’s a booming business, especially in states like North Carolina, where
marijuana remains illegal. Proponents say Delta-8 is a safe and legal
alternative for consumers seeking an intoxicating buzz thanks to the 2018
Farm Bill that legalized hemp and its derivatives. But critics question how
legal it is, and believe it’s a way to skirt federal law that currently
bans Delta-9. Given the regulatory gray area, some local hemp farmers are
steering clear. Read More (WRAL TechWire)
Consumer brands coalition steps up CBD pressure. A coalition of consumer
brands that includes Coca-Cola, PepsiCo and Kellogg is appealing to the
U.S. health regulators to get going on regulations to allow
over-the-counter CBD. The July 22 letter from the Consumer Brands
Association argues that the current U.S. policy on CBD “is not working”
because CBD is not allowed in foods, drinks and dietary supplements, but
such products are nonetheless commonly sold by companies flouting
regulations from the U.S. Food and Drug Administration. The group wrote:
“FDA inaction is resulting in a marketplace full of CBD-containing products
produced in establishments that escape FDA regulation.” Read More (Hemp Industry Daily)
Hemp having a moment as farmers try to grow niche crop into
$1-billion industry. The southern Alberta farmer has been growing hemp for 12
years, and in the early days, the distinctive odor that wafts from his
fields when the crop is in flower would invariably catch the attention of
area residents. According to Health Canada, which licenses and regulates
the industrial hemp industry in this country, there were about 22,000
hectares (50,000 acres) of hemp seeded in Canada in 2020, up from just
2,400 hectares (5,900 acres) in 1998. Canadian hemp exports exceeded
$110-million in 2019, and Manny Deol, executive director of the non-profit
Alberta Hemp Alliance says he believes this country could have a $1-billion
industry by 2030, if it does everything right. He says investors appear to
think so too, given the number of new processing facilities recently
constructed or proposed. Read More (Yahoo!)
Concentrated CBD? THC-O? As states limit delta-8 THC, industry
operators plan next steps. As state limits on hemp-derived delta-8 THC begin to
impact sales for product manufacturers and retailers, businesses are
considering how they will make up the gap. Delta-8 THC has taken the industry
by storm over the past 18 months, as manufacturers, stuck with a glut of
low-priced CBD distillate and isolate, synthesized the product into the
popular intoxicant. Because delta-8 THC is being banned specifically,
manufacturers are making a derivative substance that isn’t barred, James
Stephens, a chemical engineer and microbiologist and founder of Iron Light
LLC in Missoula, Montana said. He continued: “It’s the same kind of game
you see with a lot of the designer drug laws. Remember all the synthetic
cannabinoids that were on the market?” Read More (Hemp Industry Daily)
Hemp included in New York program backing fiber production. Hemp is now included in a
New York state program aimed at supporting fiber-based textiles. A new law
put hemp, wool, alpaca, cashmere and linen in the state’s Grown and
Certified Program, from which they can receive seals of approval. The law builds
on an existing program designed to develop local agricultural supply chains
in the state and promote New York farm products. The expansion of the Grown
and Certified Program is part of a strategy to promote the state’s fiber
industry through marketing and continuing infrastructure development, said
Assemblywoman Donna Lupardo. She continued: “It is an important step that I
hope adds momentum to a new and exciting ‘farm to fashion’ movement
building in NYS.” Read More (HempToday)
Washington will certify extracts produced for sale in other
states. Washington
state’s Department of Agriculture will begin to certify hemp extracts, in a
move officials say will help producers sell products in other states. Under
the new program, processors who want to produce hemp extract for use as a
food ingredient may apply for a hemp extract certificate that assures
compliance with Washington’s inspection and good manufacturing practices
requirements. But those products may only be sold out of state. The
Industrial Hemp Association of Washington, which backed the new law, had
said processors were being shut out of other states because of the lack of
a formal hemp production program. But the new law also affirms that CBD and
other hemp cannabinoids are prohibited in food in Washington until the U.S.
Food & Drug Administration (FDA) clarifies the status of hemp extracts
in food. Read More (HempToday)
Idaho preparing hemp plan for USDA approval. Idaho aims to submit its
hemp plan to the U.S. Department of Agriculture by September 1. First,
Idaho State Department of Agriculture (ISDA) will deliver the plan in early
August to Gov. Brad Little and the Idaho State Police — involved because
the 2018 Farm Bill requires it and the state’s new law addresses transport
— for review and approval. Draft administrative rules and other supporting
documents will be included. The Idaho Legislature this year approved
industrial hemp production, to be overseen by ISDA. The Legislature in 2022
would review related administrative rules. First plantings could come in
the spring of 2022. The law allows production and transport of hemp
containing tetrahydrocannabinol up to the 2018 Farm Bill’s limit but does
not allow in-state possession or sale of THC-containing products. Read More (Capital Press)
Oregon launches hemp field inspections to crack down on
illicit cannabis operations. Agents from the Oregon Department of Agriculture (ODA)
will visit hemp fields across the state this summer to determine whether
the operations are legitimate, and Mason Walker, CEO of East Fork
Cultivars, said this is just one component of what he calls a “very large,
sweeping bill” that contains several regulatory changes for Oregon’s
cannabis and hemp farmers. Following Gov. Kate Brown’s signing of House
Bill 3000, the Oregon Liquor Control Commission (OLCC) held a special
meeting July 19 to approve temporary rules that allow the agency to work
with the ODA to begin field testing of the state’s registered hemp farms to
determine, based on the plants’ tetrahydrocannabinol (THC) content, whether
the farmers are growing legitimate hemp or illicit cannabis disguised as
hemp. Read More (Hemp Grower)
Montana hemp farmers awarded $65 million for broken contracts.
More than
two dozen Montana hemp farmers have been awarded $65 million in damages
from Canadian and the U.S. businesses and investors who promised to pay
them up to $700 per acre for hemp grown in 2018, then failed to pay. A jury
gave 25 farmers the second-highest civil judgment in Montana history,
including $56 million in punitive damages and another $9 million in
compensatory damages for causing “mental suffering, mental anguish, grief,
worry and disappointment or the like.” The hemp defendants ordered to pay
were: 1) USA Biofuels ($10 million), 2) Eureka 93 (LXLLF) ($10 million), 3) Vitality
Natural Health ($10 million), 4) Surety Land Development ($10 million), 5)
Kent Hoggan ($5 million), 6) Owen Kenney ($5 million), 7) Corey Shirley ($5
million), and 8) David Rendimonti ($1 million). Read More (Hemp Industry Daily)
Hemp goes 'hot' due to genetics, not environmental stress. A new Cornell
study—published July 28 in the journal Global Change
Biology-Bioenergy—finds no evidence that stress on hemp plants increases
THC concentrations or ratios of CBD to THC. Larry Smart, senior author of
the study and professor in the horticulture section of the School of
Integrative Plant Science in the College of Agriculture and Life Sciences
said: “With this research, growers should feel some comfort that stresses
do not seem to have a strong effect on changing the ratio of CBD to
THC." The study further proves that genetics, rather than environment,
determine the THC content and CBD to THC ratios in hemp. Read More (Phys.org)
CBD varieties don’t perform to COAs, Georgia researchers say. The hemp industry needs a
robust certification system that will give growers more confidence in their
genetics purchases, according to a study from the University of Georgia’s
Institute of Plant Breeding, Genetics and Genomics (IPBGG). The research
found that many of the 22 hemp varieties studied expressed THC and CBD
levels inconsistent with those stated on certificates of analysis (COAs).
Several had more THC, and less CBD, than levels indicated on those
certificates, which breeders and brokers use to market the genetics. The
researchers wrote: “Given the variability we found both among and within
accessions, some sort of standardization is needed so that producers can be
confident in the material they receive.” Read More (HempToday)
RETAIL
U.S.-based Cookies plans flagship cannabis store in Toronto
this year. Gage
Growth will work with Noya Cannabis to launch Cookies products exclusively
in Ontario, Canada, before expanding into other provinces, according to a
news release. In the announcement, Gage said it expects to open a flagship
retail store in Toronto by the end of this year. Gage signed an agreement
with Cookies last November to incorporate Cookies Retail Canada Corp, or
Cookies Canada. Under the deal, Gage received 80% of the new company and as
part of a license agreement with California-based Cookies signed in April
2019, Gage holds the rights to sell Cookies-branded products in Ontario,
Canada’s largest marijuana market, per a recent regulatory filing. Read More (Marijuana Business Daily)
Lemonnade dispensary, part of Cookies family, coming to
Denver. Denver
has been a ripe market for Cookies, and the California-based marijuana
company believes there's still plenty of juice to squeeze out here.
Lemonnade, a growing branch of the Cookies family tree, opened in the
Globeville neighborhood on Saturday, July 31, according to Cookies retail
operations vice president Crystal Millican. The new dispensary, located at
4500 Washington Street, will be the first Lemonnade store in Colorado. The
brand's licensing arm has been expanding into Colorado over the past year,
with both a Cookies store in Denver and a popular wholesale operation
launching in 2020, and another dispensary opening in June in Commerce City.
Read More (Westword)
Pittsburgh has acquired the first drive-through medical
marijuana pharmacy. Healing Research Center’s medical cannabis company has
expanded to Robinson Township, offering the first drive-through to the
Pittsburgh region Medical cannabis Clinic. The new drive-through dispenser,
owned by Verano Holdings includes four different drive-through stalls.
Healing Research Center Robinson Township is the second clinic by its name
in the state, with the first clinic in Chester County. Healing Research
Center partner Healing Center announced earlier this year that it had
purchased a 50% stake and growth facility in Agronomed Biologics, which
could expand four more locations in Pennsylvania. Read More (Pennsylvania News Today)
626 groups now qualify for upcoming lottery to win marijuana
store licenses in Illinois after applications are rescored. The number of applicants
qualified for the upcoming lottery for new marijuana store licenses in
Illinois jumped to 626 — with 97% qualifying for social equity bonuses — as
a result of a rescoring of their applications and lowering the qualifying
score, state officials announced. The number marks a huge increase from the
21 applicants who were given perfect scores to qualify for a license
lottery last year. Toi Hutchinson, the state’s senior adviser for cannabis
control said: “You wanted as many people as possible to at least have a
chance, so we’re very excited about making such a big jump.” Read More (Chicago Tribune)
Lantern expands on-demand recreational cannabis delivery to
Grand Rapids. Lantern launched on-demand recreational cannabis delivery in
Grand Rapids, becoming the first marketplace to offer delivery in
Michigan's second largest city. Lantern has been serving Michigan consumers
since October 2020 when it became the first platform to launch on-demand
delivery in Detroit. Recreational consumers in Grand Rapids can now order
their favorite products and brands directly from LanternNow.com and receive
their orders in 60 minutes or less. Lantern's latest expansion will
increase access to high-quality cannabis products, especially for consumers
who live in municipalities that have opted out of permitting recreational
provisioning centers. Read More (PR Newswire)
Apple platform offers another California marijuana company
app. After
changing its terms of service this summer, the Apple App Store has added at
least three California marijuana company apps, starting with Eaze, then The
Parent Co. and now Emjay. According to a news release, the app for
marijuana delivery service Emjay debuted on the Apple platform on July 29,
allowing cannabis customers to browse businesses’ MJ menus and place orders
for deliveries in Los Angeles, San Diego and San Francisco. CEO Chris
Vaughn said: “We’re thrilled to now be live on the App Store, be one of the
first native iOS applications for cannabis shopping and to be able to
provide a more convenient and seamless experience for our customers.” Read More (Marijuana Business Daily)
Arkansas to issue pot dispensaries last two licenses. State regulators decided
that they will issue the two remaining medical marijuana dispensary
licenses allowed under Arkansas' constitutional amendment, ultimately
raising the state's total number of dispensaries to 40. Amendment 98, the
constitutional change approved by voters in 2016, allows for up to 40
dispensaries spread across eight geographic zones in the state.
Thirty-eight have been issued, and in February members of the state Medical
Marijuana Commission declined to issue the remaining two on the basis that
the applications had expired before the meeting. Three of the members on
the commission in February have since been replaced by new appointees. Read More (Arkansas Democrat-Gazette)
Lottery for marijuana dispensary licenses delayed again in
Rhode Island. Businesses hoping to win licenses to operate six new medical
marijuana dispensaries in Rhode Island will be waiting longer. The lottery
to award the coveted licenses won’t happen in the first week of August as
expected, state regulators say, because the administrative appeal of one of
the rejected lottery applicants continues. Now a lottery won’t be scheduled
“until that appeal has run its course” Matthew Santacroce, chief of the
Office of Cannabis Regulation within the Department of Business Regulation,
said. How long that will be remains unclear, Santacroce said he may have a
better sense of the timing of events “in a couple weeks,” after more
meetings between lawyers for the DBR and the rejected applicant. Read More (The Providence Journal)
Government of the Northwest Territories wants online store. The Government of the
Northwest Territories (GNWT) is hoping to boost sales and safe access to
legal cannabis with an online presence, according to a request for
expressions of interest (RFEI) posted on its open contracts site. The GNWT
suggested that a business owner could sell and fulfill orders of products
purchased from the NTLCC out of their own warehouse or directly from the
NTLCC. It could be an existing retailer with an e-commerce platform, or a
business strictly dedicated to mail-order—the sky appears to be the limit,
as long as the website is restricted to people under 19 years old, won’t
sell to certain restricted postal codes, and respects 30-gram transaction
limits. Read More (Cannabis Retailer)
Proximity to marijuana retailers doesn’t influence young
people’s intention to use cannabis. Researchers with the RAND Corporation
and with the University of Southern California assessed the relationship
between the density of marijuana retailers and subjects’ intentions to use
either cannabis or tobacco in a cohort of young adults (ages 18 to 23)
living in Los Angeles county. They concluded: “Our results suggest that
young adults who lived in an area with a greater density of any type of
outlet were not significantly more likely to report stronger intentions to
use cannabis, e-cigarettes, or cannabis mixed with tobacco/nicotine in the
future.” Read More (NORML)
PRODUCTS
Curaleaf International launches second medical cannabis flower
product for the U.K. market. Curaleaf International (CURLF) announced the launch of
its second range of medical cannabis flower products for the U.K. market.
The new products are being manufactured in the U.K. and will be an
extension to Curaleaf International’s existing range of medical cannabis
flower and oil products. Antonio Costanzo, CEO, commented: “We are very
pleased to extend our range of medical cannabis products for the UK market.
As a market leader, Curaleaf International is focused on solving the key
patient and physician challenges relating to the price, accessibility, and
sustainability of medical cannabis products. Our vertically integrated
supply chain and GMP manufacturing facilities here in the UK allow us to
scale rapidly to meet growing patient demand.” Read More (Business Wire)
Organic produce shipper rolls out hemp baby greens mixes to
food service and retail companies. Field Fresh Farms is among the first
companies to go ahead with offering hemp baby greens as an ingredient in
leafy greens salad mixes for food service and retail companies. The
specialty, new-to-market product is certified organic through the U.S.
Department of Agriculture and will be sold under the Beach Road Organics
label. The company is developing product branding and retail packaging,
which will be rolled out later this year, but raw product is available for
food service. According to a company statement the hemp baby greens mix is
touted to be “packed with nutrients,” containing omegas 3, 6 and 9,
potassium and calcium, featuring “unique flavor profiles ranging from
citrusy to earthy.” Read More (Hemp Industry Daily)
Jushi Holdings Inc. collaborates with actor Colin Hanks. Jushi Holdings (JUSHF) announced that it
partnered with Colin Hanks to bring his handkerchief line, Hanks Kerchiefs,
to select BEYOND / HELLO retail stores. The collaboration expands on
Jushi’s vision for BEYOND / HELLO to work with new and like-minded partners
to build the company's brand into a modern retail leader that blends
exclusive and unique offerings with cultural experiences. The line of
kerchiefs created by the actor, producer and director is now available for
purchase at select BEYOND / HELLO dispensary locations, as well as online
nationwide at Shop Jushi. In addition, a portion of each Hanks Kerchiefs
sold will support several charities such as Homes for Our Troops, a nonprofit
organization that builds homes for veterans. Read More (GlobeNewswire)
Competition rising over shelf space for hemp foods. Canada has long fed the
world’s demand for hemp foods. Over the past three years, Health Canada has
reported an average of 75,133 acres of industrial hemp production, with
48,045 (nearly 64%) of those dedicated to grain production. The president
of the Canadian Hemp Trade Association, Ted Haney, is confident of seeing a
15%-20% increase in Canadian hemp by the end of this year, a development
made more notable given a 37,540-acre decrease in Canadian cultivation from
2019 to 2020. As consumers increasingly notice hemp-based foods appearing
on store shelves, competition for the dollars of hemp hearts consumers has
been spurred. Read More (New Frontier Data)
|
Chart 16: Canadian Hemp Acreage
|
|
|
Source: Intro-act, New Frontier Data
Marijuana vape manufacturers, retailers in limbo over
long-delayed mail ban. Months of delay on the U.S. ban on shipping vape components
has marijuana and hemp operators wondering if they should prepare for
seismic shocks to their business models or proceed as usual and hope the
ban never takes effect. The ban was supposed to kick in last spring, the
result of a 2020 law that prohibits the U.S. Postal Service from shipping
vaping products. The ban included products without nicotine and could
eliminate direct-to-consumer vape shipping. But in April, when the USPS
said it planned to publish details on enforcing the ban, the agency said it
needed more time to review public comments. Read More (Marijuana Business Daily)
Exploring Twitter data on cannabis edibles. Scientific, economic, and
social research on cannabis is occurring at a pace faster than at any other
time in history. As technology advances, so do the ways in which
researchers gather information. Twitter is relatively new to modern
society, and it has become a valuable source of information on cannabis
use, notably for a study on edibles. In 2016, researchers published a study
in which they analyzed the content of Twitter messages relating to cannabis
edibles. Their principal objective was to analyze Twitter users’ perception
of edibles. In general, researchers found that the sampled Twitter users’
experiences with edibles were positive overall, with 56.8% of them relating
a positive attitude compared to only 13.2% being negative. Read More (Extraction Magazine)
Cannabis pre-roll sales soar as Canadians share joints less
during pandemic. Canadian cannabis users are doing a lot less puff, puff, pass
during the COVID-19 pandemic, as people try to minimize their distance and
contact with one another. Research commissioned by the Smiths Falls, Ont.
company revealed that the pre-roll joint category grew by 48 percent across
the entire market between January and May 2021. A report from the Ontario
Cannabis Store shows almost $97 million of pre-rolls were sold between April
2020 and March 2021, up from $42.6 million between April 2019 and March
2020. Part of that sales increase is attributable to a significant rise in
the number of cannabis stores, but Canopy Growth (CGC) says Canadians who feel
that traditional 0.5 gram joints are too big for them to enjoy in one
sitting, and who worry about passing germs along with joints, are factors
as well. Read More (msn)
The future of cannabis and the beverage industry: an interview
with Keith Villa. When asked about what effect could legalization have on the
brewing industry? Keith Villa said: “It’s a mixed bag. Right now, you can’t
mix cannabis and alcohol on a federal or state level. I don't see that
changing anytime soon, even though people think you could get a really good
buzz if you combine them. There's a cautionary tale that people should pay
attention to from the early part of this century when Four Loco was the
rage. They mixed high levels of caffeine and alcohol in a drink. It led to
many people getting quite sick, and the FDA put out rules banning that. So,
we should not rush into that until we know more, but there will be a boom
of non-alcoholic beers with THC in them should the laws change. You can
make those now in states where recreational cannabis is allowed.” Read More (Forbes)
How cannabis vaporizers are continuing to evolve. There’s controversy out
there about who should be credited as the originator of modern-day herb
vaporization, but research suggests the first ever e-cig was created in
1927 by Joseph Robinson. After that, the first “smokeless non-tobacco
cigarette,” was created by Herbert Gilbert in 1963. And the first portable
herb vaporizer, called the “Shake and Vape,” was created in 1993 by Eagle
Bill Amato. Shortly after that, Storz and Bickel came out with the famous
tabletop Volcano vaporizer in 2000. In 2003, Chinese researcher Hon Lik
came up with modern e-cigarette technology that eventually birthed
510-threaded vape cartridge technology, and in 2007, Pax Labs—originally
called Ploom—created a weed vaporizer that eventually led to the
closed-loop system of proprietary cartridges, like the PAX Era for
cannabis. Read More (Leafly)
SOCIAL
The first social media for cannabis patients launched. EcoCaNN, the first social
media for medical cannabis patients, was launched officially in Israel. The
app allows patients and their families to consult and to get assistance by
the best professionals in the medical cannabis field, and to get specific
answers to their questions 24/7. EcoCaNN is based on a free digital
platform and the information in the app is protected, anonymous, and
confidential. EcoCaNN was established by the international pharma company
MediCane, which focuses on the research and development of medical
cannabis-based pharmaceutical medicines. The app is part of MediCane's
vision that promotes the accessibility of accurate information through the
app that may benefit and assist in the treatment of those who are treated
with medical cannabis, and also assist doctors and researchers in their
R&D efforts. Read More (Calcalist)
For many cannabis consumers, home is where the grow is. Approximately 6% of
cannabis consumers grow their own flower. Among those surveyed, more than
six in 10 homegrowers were men. Some opt-in due to a lack of other sources
(14%), or to grow strains which they otherwise could not find to purchase
(35%). Quality is another key consideration. Nearly one-third (32%) grow to
avoid worries about contaminates such as pesticides, while 44% feel that
they grow better-quality flower than they could find elsewhere. For others,
it is a matter of convenience (52%), or less expense (46%). Nevertheless, a
larger majority of home growers (70%) report growing cannabis because they
enjoy it as a hobby. Read More (New Frontier Data)
|
Chart 17: Cannabis Consumers’ Motivation for
Home Cultivation
|
|
|
Source: Intro-act, New Frontier Data
INTERNATIONAL
Initiative to consolidate the global hemp industry is
launched. Organizations
from around the world are joining to form an international association to
advance the interests of the hemp industry. The new body, as yet unnamed,
will work to establish industry development priorities, and officially
represent hemp stakeholders before global intergovernmental agencies, with
a core first objective to remove hemp and hemp extracts from the 1961 UN
Single Convention on Narcotic Drugs, said Daniel Kruse, president of the
European Industrial Hemp Association, and one of the initiators of the
global effort. The group intends to interface with international agencies
such as the World Health Organization, the UN’s Committee on Narcotic
Drugs; the Organisation for Economic Co-operation and Development; and the
UN’s Food & Agriculture Organization (FAO) on matters related to that
agency’s Codex Alimentarius, internationally recognized standards for food
production and safety. Read More (HempToday)
Green and pleasant land? The future of cannabis use in the
U.K. An
interesting development was the announcement by British American Tobacco
that it envisioned cannabis as part of its future business model as sale
and use of cigarettes continues to decline. BAT bought a stake in Organigram (OGI) earlier this year, and has
begun to fund research into a new range of adult cannabis products. What
might the future look like, then, if cigarette sales continue to fall and
other products are teed up to take their place? Vaping is very much part of
the landscape now: there were around 11 million vapers worldwide a decade
ago, but that number is today more like 50 million. And cannabis fits
neatly into the vaping market: cannabidiol (CBD) liquid can be smoked in a
vape easily and is sold as relieving anxiety and physical pain. Read More (msn)
Fall elections to sway momentum for Czech Republic’s legal
cannabis reforms. The Czech Republic is making waves in the cannabis sector –
and an upcoming national election may prove pivotal to its domestic
industry. Other push factors are favoring medical cannabis: last year, a
ruling that 90% of the cost of medical cannabis (of up to 30 grams per
month) must be covered by insurance agencies drove further growth, and the
first months of this year saw twice the amount of medical cannabis used in
year-over-year comparison to 2020. The State Agency for Medical Cannabis in
January reported that a total of 67 kilograms of medical cannabis had been
prescribed last year (nearly a fourfold increase from 17 kg in 2019), and
that the rolls of cannabis-prescribed patients increased from less than 500
in 2019 to 1,103 by last December. Read more (New Frontier Data)
|
Chart 18: Czech Republic Making Waves With Legal
Cannabis
|
|
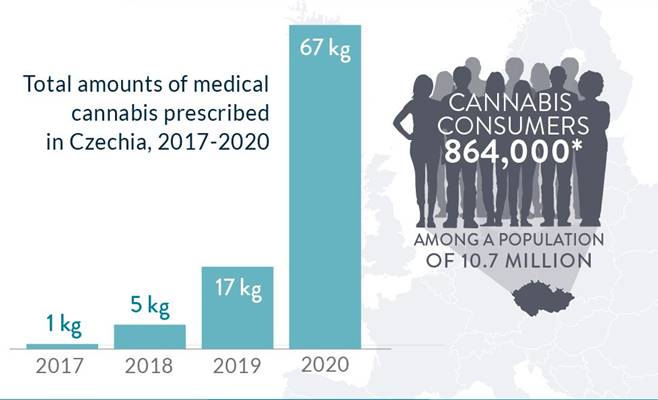
|
Source: Intro-act, New Frontier Data, Expats.cz,
State Agency for Medical Cannabis (SAKL)
Colombia boosts budding cannabis industry by removing ban on
dry flower exports. Colombia gave the green light for exports of dried cannabis
for medical and other industries, as the Andean country took another step
to develop its marijuana industry, where progress has been slow despite
high potential. President Ivan Duque signed a decree lifting a prohibition
on exporting dried cannabis flower, a move seen as crucial by investors.
The directive also allows for the expansion of sales of cannabis-based medicines
and streamlines regulatory procedures. While Colombia has been hailed as a
pioneer in regulating the possession, production, distribution,
commercialization and export of seeds, plants and substances derived from
cannabis - like oils, creams and extracts for medicinal purposes -
investors have long complained about what they say is a tortuous
export-approval process. Read More (Reuters) and More (High Times)
Israeli lawmakers rejected a bill to decriminalize marijuana
and reclassify CBD as a food additive. Prior to the defeat, the coalition
managed to get one crucial win, when the Knesset voted 64 to 50 against a
bill calling for the government to express its sovereignty over all of
Judea and Samaria. The coalition suffered a major defeat, when a draft bill
to decriminalize the recreational use of up to 50 grams of cannabis for
personal use and up to 15 seeds, while also reclassifying CBD as a food
additive, failed to get a majority in the Knesset after the Ra’am Party
decided to vote against the bill. The bill’s failure to pass means that the
coalition would have to wait another six months until it could attempt to
bring it to the Knesset plenum for a vote again. Read More (The Jerusalem Post)
CANNA SCIENCE
Is organic the way forward for the marijuana industry or is it
just too expensive? A more significant percentage of cannabis producers think that
the organic discourse comes from a selfish impulse. They believe that the
consumer's desire only to use the cleanest buds is due to their demand for
superior taste. However, on closer investigation, people are also seeking
organic cannabis to advocate for healthier products that are safe for the
planet. But the production of organic products costs more for both the
producers and suppliers; it also doesn't have real-time advantages in the
marketplace. Cannabis experts worry that their users may start looking for
the "Organic" label on their buds like they do with other items
they buy at grocery stores. Read More (Cannabis.net)
Some cannabis extractors are turning to contentious
color-remediation process. A process commonly used in food and wine production –
color remediation – is becoming increasingly popular in cannabis extraction.
Manufacturers are looking to remove impurities, produce translucent
extracts year-round and remove chlorophyll molecules that leave a “grassy”
taste in rudimentary cannabis edibles. The extra step doesn’t cost much and
can drastically improve the purity and clarity of extracts made with butane
hash oil or ethanol solvents. But the process is not without detractors who
say it is too often used to remediate old or inferior cannabis inputs. In
addition to giving the extractor control over the color, remediation
filtration can remove: 1) pesticides or other unwanted contaminants, 2)
chlorophyll, 3) plant sugars, and 4) lipids. Read More (Marijuana Business Daily)
|
Chart 19: Color Remediation in Cannabis
|
|
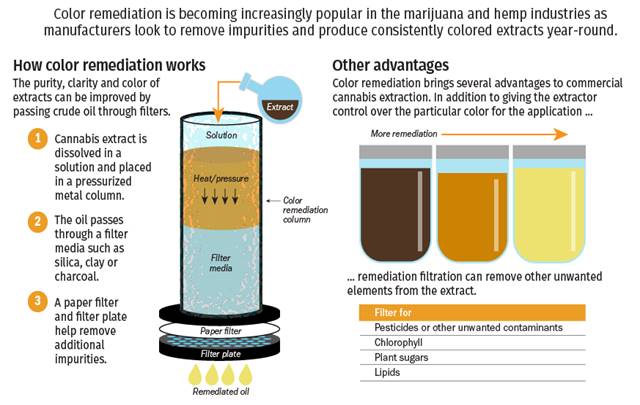
|
Source:
Intro-act, Precision Extraction Solutions, Chem Tek, Marijuana Business
Daily
TECHNOLOGY
Cannabis needs a tech-first approach. To improve the
technological prowess of a company, it is important to realize there are
necessary steps to prime the environment for technology to be successful in
every organization. Most of this is centered around the organization’s
decision-making process: 1) technology must have representation, 2)
technology must have a seat at the decision-making table, 3) the
decision-making process must be formal and managed, 4) technology must have
an allocated budget, 5) technology tasks and projects must be formal and
managed, 6) walk before you run, and 7) technology has to be part of your
company strategy. Read More (CannabisTech)
Cannabis cultivation is all about control. With cannabis cultivation,
novices may think it’s a matter of putting a seed in the ground and growing
a plant at the whims of mother nature. However, those who’ve attempted to
grow their own cannabis know it’s quite a bit more complex than that.
Whether you’re growing six plants or 6,000 – consistent, precise conditions
and environmental controls are the keys to high-quality cannabis.
Fortunately, today there are new and emerging tech tools to help at all
levels of cultivation, from personal use to commercial production. In
commercial cannabis production, many factors can negatively impact the
final outcome of the crop. Thanks to the development of powerful sensors,
commercial producers can monitor their investment 24 hours a day, seven
days a week, from anywhere. Read More (CannabisTech)
Options in commercial automated grow tech for cannabis. 1) Agrify offers premium,
fully integrated indoor grow solutions for growing consistent cannabis,
hemp, and other high-value crops at the lowest possible cost. 2) While
attempting to disrupt the climate impact of traditional cultivation
techniques, Agdaptive provides growers with data-driven platforms in the
correct size. 3) The American Cannabis Company provides end-to-end
consulting and product solutions for medical, adult-use, and low-THC
regulated cannabis markets both nationally and internationally. 4) Freight
Farms is dedicated to making fresh food accessible to anyone, anywhere, any
time, with a complete platform of products and services to empower a global
community of partners. Read More (CannabisTech)
Cleanroom technology for cannabis production. Many cannabis and hemp
producers have accepted that as a consumable agricultural crop, used both
for medicinal properties as well as a recreational intoxicant; there will
be very high standards set for cannabis and hemp production. Improper HVAC
systems can encourage mold and fungus growth. Even the humans working with
the plants can carry potential hazards into the grow room. Fortunately,
there are several ways to prevent crop loss and keep production facilities
free and clear of contaminant which includes: 1) personal protective
equipment, 2) air showers, 3) CO2 spray treatments, 4) HVAC, room pressure
and air filtration, and 5) air purification systems. Read More (CannabisTech)
World renowned extraction guru, Dr. John MacKay, opens first
institute of extraction technology. Dr. John MacKay’s Institute of Extraction
Technology partners alongside the CBD Expo Tour to offer courses on each
stage of the extraction process. The first full-day intensive course will
be offered on August 26th, 2021 at the DoubleTree by Hilton Hotels, one day
prior to MACE Media Group’s Original CBD Expo SOUTHEAST & Delta 8
Conference. Attendees of the course will get hands-on experience with
actual extraction and cannabinoid testing as well as free admission to The
CBD Expo SOUTHEAST. Student will have the opportunity to receive a Certificate
of Attendance for Merging Business and Science of Extraction & a
Certificate of Attendance and Passing Competency Test. Read More (Extraction Magazine)
LEGAL & IP
Three Oregon hemp businesses accused of mistreating seasonal
workers. Three
Oregon hemp companies are being sued by more than a dozen seasonal workers
who say the businesses required them to sleep on dirty floors and use the
bathroom outside. Those are among the health-and-safety violations alleged
in a lawsuit filed by 17 migrant workers suing West Coast Growers, Topshelf
Hemp and Fire Hemp, all managed by the same man in Grants Pass, Oregon.
Among the workers’ charges: 1) the companies withheld wages and required
them to work without lunch or rest breaks during the 2020 harvest, 2) they
had to share a trailer with a single bed, 3) they were lodged in an
“abandoned, dilapidated, and unsafe” empty house without heat or running
water, and 4) they shared an outdoor portable toilet that wasn’t emptied. Read More (Hemp Industry Daily)
Arbitration panel awards Jushi Holdings $14.4 million in
Harvest Health & Recreation Florida subsidiary dispute. Jushi Holdings (JUSHF) announced that the
American Arbitration Association awarded $14,364,920.10 to Jushi FL SPV, a
subsidiary of Jushi Holdings, in its dispute against San Felasco Nurseries,
a subsidiary of Harvest Health & Recreation (HRVSF). The interim award
consists of $10,637,012 in damages, plus $3,727,908.14 in pre-award
interest (accrued at a rate of $3,497.099 per day) and post-award interest
at a rate of 12% per annum. The Interim Award is based on breach of
contract and breach of implied covenant of good faith claims brought by
Jushi against San Felasco in October of 2018. In its order, the Panel found
that San Felasco improperly terminated its franchise agreements with Jushi
FL without cause and in bad faith. Read More (New Cannabis Ventures)
New Mexico marijuana operator prevails in drawn-out legal
case. In
what seems like a mere formality at this point, a New Mexico appellate
court upheld a 2018 lower court ruling allowing the state’s largest medical
marijuana operator, Ultra Health, to open two new dispensaries. Ultra
Health went ahead and opened the two new retail outlets after prevailing in
a lower, district court case in October 2018, the Santa Fe New Mexican
reported. In fact, Ultra Health has opened 16 dispensaries since that
ruling and now operates 25 statewide, according to a company news release.
Back in 2018, the New Mexico Department of Health refused to approve the
two dispensaries, one on the grounds it was located inside a senior living
facility and another because of stocking issues. Read More (Marijuana Business Daily)
Massachusetts medical cannabis dispensary sued over $21
million debt. According to the Boston Business Journal, Ermont is being sued
for $21.8 million by Teneo Funds SPVi. Teneo requested in its lawsuit that
the court halt any transfer of assets by the dispensary and that a receiver
be appointed to run the medical marijuana business. The lawsuit follows
Teneo’s acquisition of the debt from Ermont’s former creditor, Tilt Holdings (SVVTF), which sold the debt to
Teneo in February for $1.25 million and a portion of future collections – a
fraction of the overall value. Tilt Holdings acquired the debt in 2018 and
extended a line of credit to Ermont. Read More (Marijuana Business Daily)
Lawsuit that could have delayed Illinois cannabis business
licensing dropped. According to the Chicago Sun-Times, Sozo Illinois
dropped the federal lawsuit it filed July 16 claiming that social equity
rules for the marijuana permits are “fundamentally unfair” and requesting
that the licensing process be halted. Illinois authorities are scheduled to
hold three lotteries starting July 29 to determine the winners of the 185
business licenses. The move comes after social equity advocates pleaded
with Sozo Illinois to drop the suit during a news conference, calling the
action “hurtful to social equity and racial equity” in the marijuana
industry. Sozo issued a statement supporting social equity, but the company
remained critical of the law overseeing the licenses being issued. Read More (Marijuana Business Daily)
CANNA FACTS
|
Chart 20: Top Cannabis Sales
Days of 2021
|
|
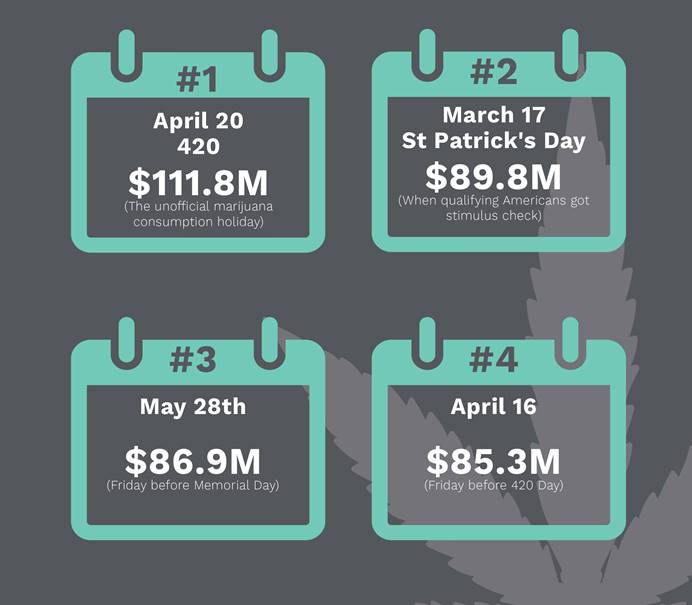
|
Source:
Intro-act, Akerna’s 2021 Cannabis Industry Mid-Year Review
ETF SPOTLIGHT
THCX The Cannabis ETF (NYSEARCA: THCX)
|
Closing
Price (7/30/21)
|
$15.32
|
1
Week NAV Change
|
0.3 (+1.9%)
|
NAV
Change (YTD)
|
23.97%
|
|
AUM
(as of 7/30/21)
|
$134.7
Mn
|
Fund
Inception
|
7/8/2019
|
Expense
Ratio
|
0.70%
|
THCX:
the pure-play ETF solution for investing in cannabis. Supported by
favorable regulatory trends, increasing use cases and growing public
acceptance, cannabis is one of the fastest growing current investment
themes. To put the opportunity into perspective, the global cannabis market
is estimated to reach $630 billion by 2040. THCX was constructed to make
investing in cannabis easier by helping investors get exposure to a basket
of stocks that are expected to benefit from growth of the hemp and legal marijuana
industries. THCX is a fund focusing mainly on North American
cannabis companies, specifically in the U.S. and Canada. The initial
universe of Index constituents consists of publicly listed Cannabis
Companies that are involved in the legal cannabis industry. “Cannabis” is
defined as (i) marijuana (or products derived from marijuana) and (ii) hemp
(or products derived from hemp, which includes CBD-based products (i.e.,
products that contain cannabidiol).
Monthly Market Performance (Month Ending 7/31/2021)
|
One Month
|
Two Months
|
Three Months
|
YTD
|
One Year
|
Inception
|
|
-10.67%
|
-14.16%
|
-16.4%
|
22.58%
|
49.96%
|
-17.32%
|
Quarterly Market Performance (Quarter Ending 6/30/2021)
|
One Month
|
Two Months
|
Three Months
|
YTD
|
One Year
|
Inception
|
|
-3.90%
|
-6.42%
|
-9.77%
|
37.23%
|
82.58%
|
-13.16%
|
Top 10 Holdings (updated as of 7/30/21)
|
Ticker
|
CUSIP
|
Company
|
% of Fund
|
Quantity
|
|
VFF
|
92707Y108
|
Village
Farms International
|
6.24%
|
864,958
|
|
TLRY
|
88688T100
|
Tilray Inc -
Class 2 Common
|
6.01%
|
542,918
|
|
CGC
|
138035100
|
Canopy
Growth Corp
|
5.56%
|
390,489
|
|
GRWG
|
39986L109
|
GrowGeneration
Corp.
|
5.10%
|
167,146
|
|
OGI
|
68620P101
|
Organigram
Holdings Inc
|
4.81%
|
2,451,539
|
|
CRON
|
22717L101
|
Cronos Group
Inc
|
4.59%
|
826,150
|
|
AMRS
|
03236M200
|
Amyris Inc
|
4.44%
|
405,465
|
|
FAF CN
|
318108107
|
Fire &
Flower Holdings Corp
|
4.44%
|
7,866,114
|
|
HYFM
|
44888K209
|
Hydrofarm
Holdings Group Inc
|
4.32%
|
115,453
|
|
RIV CN
|
768014102
|
RIV Capital
Inc.
|
4.14%
|
3,624,236
|
For more
information on THCX visit: https://thcxetf.com/fund/
CANNA CAPITAL MARKET TRENDS
|
Chart 21: Weekly Summary (July 19 – July 23,
2021)
|
|

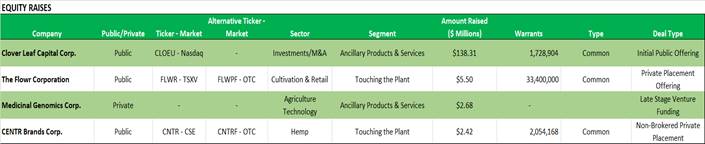
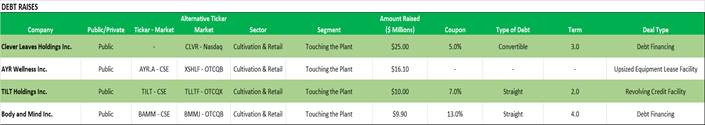
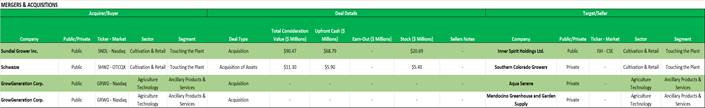
|
|
Chart 22: Cannabis Capital Raises by Week (2021)
|
Chart 23: Cannabis M&A by Week (2021)
|
|
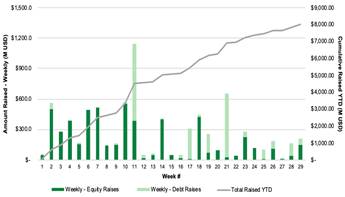
|
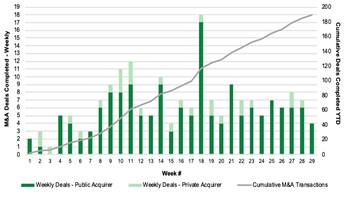
|
Source:
Intro-act, Viridian Capital Advisors
CANNA PRICES – WEEKLY TREND
|
Chart 24: U.S. Cannabis Spot Price (Week Ending July
30, 2021)
|
|
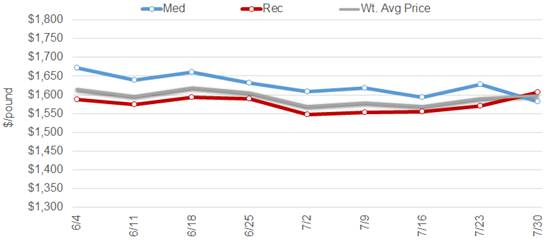
|
Source:
Intro-act, Cannabis Benchmarks Price Index
|
Chart 25: U.S. Implied Forward Prices (Week Ending
July 30, 2021)
|
|
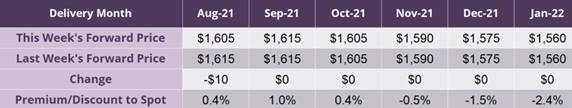
|
Source:
Intro-act, Cannabis Benchmarks Price Index
|
Chart 26: Canada Cannabis Spot Index (Week
Ending July 30, 2021)
|
|
|
Source:
Intro-act, Cannabis Benchmarks Price Index
CANNA BRANDS AND PRODUCTS RANKING –
STATE IN FOCUS: BRITISH COLUMBIA
|
Chart 27: Best-Selling Flower Brands and
Products in British Columbia
|
|
|
Source:
Intro-act, Headset
|