DEAL IN FOCUS: THE BENEFICIENT COMPANY GROUP – AVALON ACQUISITION INC. (AVAC)
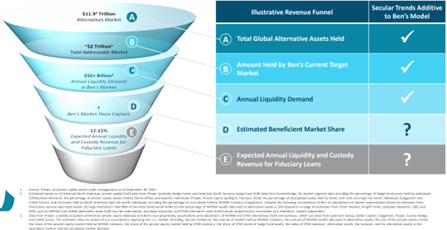
The Beneficient Company Group (Ben) provides a unique suite of simple, rapid, and cost-effective liquidity solutions and other financial and fiduciary services for owners of alternative assets. Ben's liquidity solutions are available for most types of professionally managed alternative asset investments and can be customized to suit individual circumstances. The company’s cybersecure-certified AltAccess portal is the first widely available venue for exchanging alternative assets from a balance sheet provider acting as a regulated fiduciary, is subject to regulatory oversight, and is powered by over 800,000 lines of proprietary code. Ben has identified a significant market opportunity of approximately $2 trillion in alternative assets held by U.S. Medium-to-High Net Worth investors and Small-to-Medium Sized Institutions with annual liquidity needs of over $50 billion, among the $11.9 trillion in alternative assets held globally. The popularity of alternative assets has resulted in a wider range of investors, including families and small-to-medium sized institutions, holding them. This growth has also led to an increasing demand for liquidity. While large investors can access liquidity through an unregulated and often complicated market, they do not receive the protections of a regulated fiduciary. This puts the investor at a disadvantage. In response, Ben has developed AltAccess and a regulated framework to act as a fiduciary for mid-to-high net worth investors and small-to-medium sized institutions and address the growing demand for liquidity in this market.
|
Chart 1: Translation from Market Opportunity to Ben’s Serviceable Market |
|
|
Source: Intro-act, AVAC/The Beneficient Company Group Investor Presentation
|
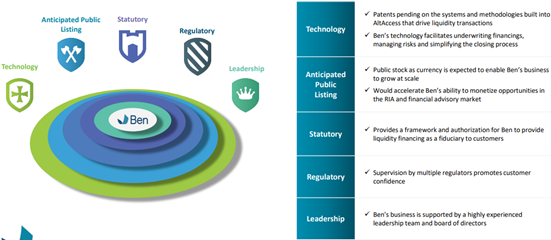
Chart 2: Competitive Advantages That Set Ben Apart |
|
|
Source: Intro-act, AVAC/The Beneficient Company Group Investor Presentation
The company has delivered liquidity on approximately $1.1 billion in net asset value of alternative investment holdings to date. This includes a range of investment types such as real estate, private equity, venture capital funds, and more, across various sectors and geographies. In the fourth quarter of 2021 and first quarter of 2022, Beneficient delivered $383 million in liquidity. Beneficient’s primary business units, Ben Liquidity and Ben Custody & Data, were profitable based on segment operating income in 2021, although the consolidated company had an operating loss in 2021. Notably, Beneficient has a growing network of wealth management partners, including broker dealers, RIAs and private banking platforms, and general partners. These partners can look to Ben as a “Preferred Liquidity Provider” that can deliver affordable, consistent, and reliable services. The company has also launched its own broker-dealer, Ben Securities Company, to support its plan and strategic priorities. It has been proprietarily sourcing and underwriting loans with alternative asset positions as the source of collateral since inception. It has also completed liquidity transactions across 11 sub-classes of alternative assets, with positions in virtually every industry in which alternative asset managers invest and across five continents.
|
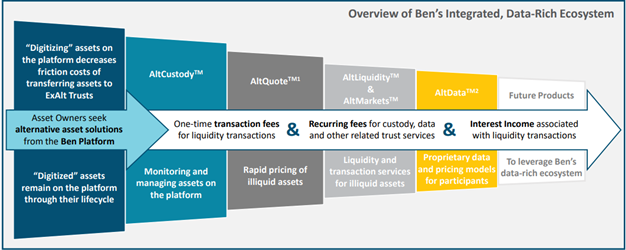
Chart 3: Ben’s Regulated and Technology-Driven Ecosystem |
|
|
Source: Intro-act, AVAC/The Beneficient Company Group Investor Presentation
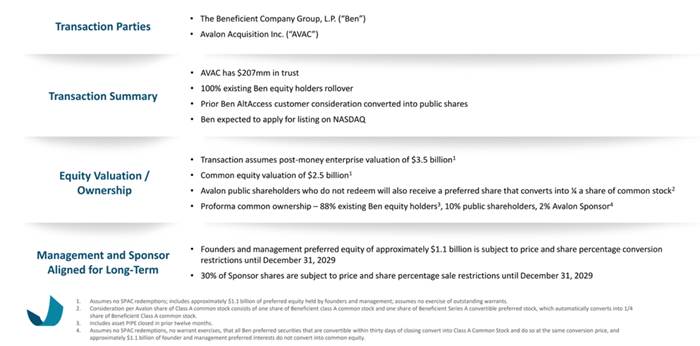
In September 2022, Ben announced a business combination with Avalon Acquisition Inc. (Nasdaq: AVAC) that values the company at $3.5 billion (enterprise value), including approximately $200 million in gross proceeds from Avalon’s cash in trust – assuming no redemptions. Upon the closing of the transaction, and assuming no public stockholders redeem their shares, existing Ben shareholders are expected to continue owning 88% of the combined company, with public stockholders expected to own 10%, and Avalon sponsors expected to own 2%. Upon closing, the combined entity would have access to the capital markets to offer more liquidity options and better serve investors in a historically costly and opaque market.
- The transaction is expected to close in 1H23. Upon the closing of the transaction, the combined company will be named Beneficient and is expected to be listed on Nasdaq.
|
Chart 4: Transaction Details |
|
|
Source: Intro-act, AVAC/The Beneficient Company Group Investor Presentation
DEAL IN FOCUS: AEON BIOPHARMA, INC. – PRIVETERRA ACQUISITION CORP. (PMGM)
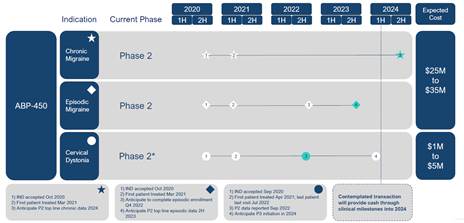
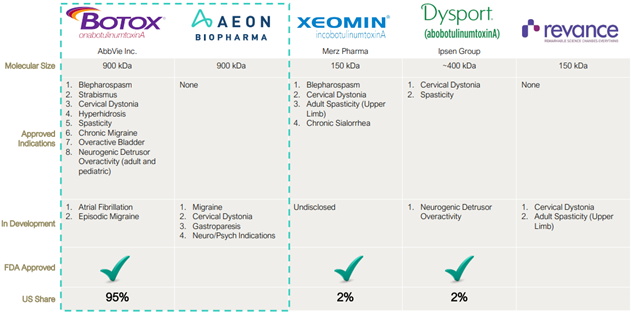
AEON Biopharma, Inc. is a clinical-stage biopharmaceutical company focused on the development of its proprietary botulinum toxin complex ABP-450 (prabotulinumtoxinA) injection for therapeutic indications. Since 2019, the company is dedicated to innovation in the rapidly expanding therapeutic botulinum toxin market and believes its therapeutic-only focus will allow AEON to advance safe and effective treatment options to patients, while delivering differentiated economics to payors and physicians. The global therapeutic neurotoxin market is currently estimated to be $3.0 billion, of which the U.S. represents approximately 84%, and projected to grow to approximately $4.4 billion in 2027, registering a CAGR of 8% during the period. Abbvie Inc. markets BOTOX® and it dominates the U.S. market for therapeutic purposes related to neurotoxins, with a market share of around 95%. Other neurotoxin competitors have seen success in the cash-pay aesthetic market, but they have failed to make a significant impact in the therapeutic market due to the impact of pricing for aesthetics on reimbursement, which results in a low value proposition for both payors and providers. AEON intends to file a separate Biologics License Application (BLA) for therapeutic purposes that would not be affected by the reimbursement issues faced by other neurotoxin competitors who have both aesthetic and therapeutic indications approved under a single BLA.
|
Chart 5: AEON – Development Timeline Includes Multiple Clinical Near-Term Milestones |
|
|
Source: Intro-act, AEON Biopharma Investor Presentation
|
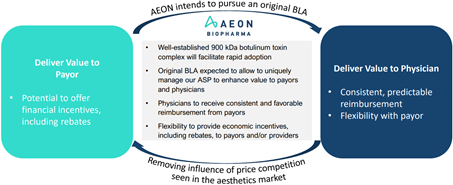
Chart 6: AEON’s Strategy Provides Value to Payors and Physicians Alike |
|
|
Source: Intro-act, AEON Biopharma Investor Presentation
AEON presents a promising opportunity in the migraine prevention market, as the second competitor in this single largest toxin therapeutic indication, representing 45% of therapeutic toxin sales. The product offers differentiation in the market through its unique injection paradigm, featuring fewer injections (22 injections vs. 31 injections) compared to the market leader and potentially delivering a safety and tolerability benefit. The therapeutic-only focus of AEON also provides pricing flexibility, avoiding the negative impact of heavy discounting from aesthetic toxin SKUs seen in the market. Competition in the market is impacted by bundling and cross-product pricing dynamics, while therapeutic indications are typically single product treatments, limiting the pricing strategies that can be deployed to deter new market entrants. However, new market entrants have been hindered in the past by differentiated toxin characteristics, complicating physician adoption. With its 900 kDa weighting and similar characteristics to existing products, AEON's transition to ABP-450 is expected to be simplified, resulting in low switching costs for physicians and patients alike. AEON’s therapeutic-only focus also provides a differentiated business model designed to deliver enhanced value to payors and providers by permitting a traditional pharma pricing model that is not currently available to competitors that also market their products for aesthetic uses approved under a single BLA. The sole focus on therapeutics allows AEON to pursue an original BLA filing that would allow a unique commercial strategy that cannot be employed by other competitors.
|
Chart 7: Global Therapeutic Toxin Competitive Landscape |
|
|
Source: Intro-act, AEON Biopharma Investor Presentation
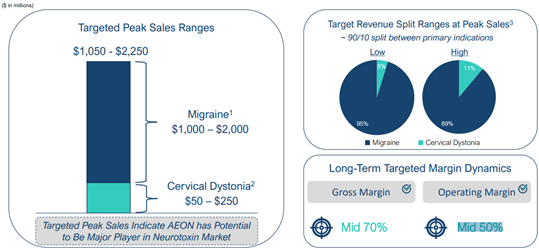
AEON has the potential to become a major player in the neurotoxin market, as evidenced by its targeted peak sales ranges of $1,050 – $2,250 million. The product has been specifically designed to target two indications – migraine prevention and Cervical Dystonia – with targeted peak sales ranges for each indication of $1,000–$2,000 million and $50–$250 million, respectively. At peak sales, the target revenue split ranges for AEON are expected to fall within a 90/10 split between its two primary indications – migraine prevention and Cervical Dystonia. The low end of the revenue split ranges estimates a 95% contribution from migraine and 5% from Cervical Dystonia, while the high end predicts an 89% contribution from migraine and 11% from Cervical Dystonia. AEON has a long-term targeted margin strategy that aims to deliver sustainable and profitable growth for the company. The targeted gross margin for AEON is set at mid-70%, indicating the company's focus on efficiently managing its cost structure and maximizing profitability. Additionally, the targeted operating margin for AEON is set at mid-50%, reflecting the company's commitment to delivering value to its shareholders and stakeholders.
|
Chart 8: AEON Target Financial Profile in 2035 |
|
|
Source: Intro-act, AEON Biopharma Investor Presentation
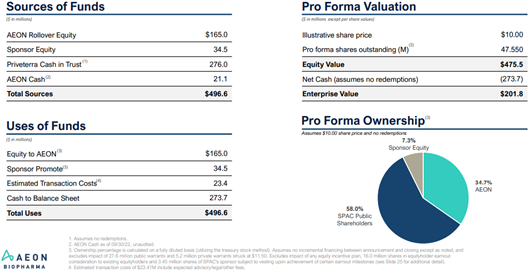
In December 2022, AEON Biopharma, Inc. announced a business combination with Priveterra Acquisition Corp. (Nasdaq: PMGM) that values the company at $475.5 million (post-money equity value) and is expected to provide $276 million in gross cash proceeds. Priveterra will acquire 100% of AEON in exchange for the issuance of 16.5 million shares of common stock of Priveterra (valued at $10 per share) to the existing shareholders and convertible noteholders of AEON at close (before milestone-based earnouts). Priveterra’s sponsor has also allocated 50% of its common stock to an earnout based on achievement of certain clinical milestones.
- The transaction is expected to close in 1H23. Upon the closing of the transaction, the combined company will operate as AEON Biopharma, Inc. and is expected to list on Nasdaq under the ticker symbol "AEON."
|
Chart 9: Transaction Details and “Pay for Performance” Earnout Structure |
|
|
Source: Intro-act, AEON Biopharma Investor Presentation
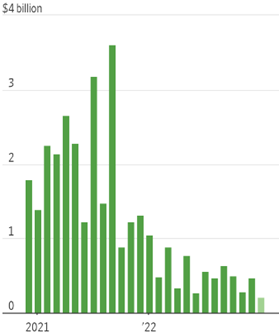
SPAC deals shrink after speculation wanes. Some of Wall Street’s most speculative investors are scaling back their ambitions, doing deals that are a 10th the size of their flashy, top-of-market acquisitions. Creators of SPACs are valuing companies they seek to take public at the lowest levels since the boom began nearly three years ago, figures from Dealogic show. The average announced SPAC merger value has fallen to about $200 million so far in January, down from more than $2 billion for much of 2021 during the sector’s peak. “It reflects the change in the broader market and investor sentiment,” said Brian Dobson, a senior research analyst at investment bank Chardan focused on the sector. “Investors are much more interested in steady-Eddie companies than potential highfliers.” Read More (The Wall Street Journal)
|
Chart 10: Average Announced Valuation of Companies Going Public Through SPACs, Monthly |
|
|
Source: Intro-act, The Wall Street Journal
Hundreds of SPACs are running short of time to complete mergers. For more than 200 blank-check companies, time is running out to find merger partners. Twenty-eight such entities face deadlines to complete a combination, according to a report from SPAC Research. Some 85 have February deadlines and another 113 need to complete a merger by March, according to the report. If they don't complete such deals by their deadlines, the SPACs will have to either ask shareholders for more time or hand back the cash they raised in their initial public offerings to their investors. Many SPACs that have already run up against their deadlines without completing combinations have taken the latter course. In the first 11 months of 2022, 55 blank-check entities liquidated their assets, according to the SPAC Research report. That number soared to 87 in December alone. Read More (The Business Journals)
Deal-needy SPAC sponsors flock to tiny tie-ups as clock ticks. Deal-hungry blank-check companies dashing to meet deadlines are eyeing smaller targets as the SPAC mania that led to dozens of multi-billion-dollar mergers fizzles. Calidi Biotherapeutics and First Light Acquisition Group are among the latest to announce a tie-up, assigning the biotech an enterprise value of $335 million. While another SPAC deal valuing Calidi at $449 million fell apart five months ago, the new tie-up underscores sponsors’ desperate hunt for targets as merger deadlines loom. Read More (Bloomberg)
The special purpose acquisition company fallout is going to be spac-tacular. Last year may have been an annus horribilis for the IPO market, but it was an annus calamitosas for special purpose acquisition companies, or SPACs. SPACs are blank-cheque vehicles designed as a backdoor way for a private company to list on the stock exchange without going through the expense and uncertainty of an initial public offering. But things have gone pear-shaped. For one thing, investors have suffered bone-crushing losses, as companies merging with SPACs have vastly underperformed the stock market. The AXS De-Spac ETF fell almost 75% in 2022. Meanwhile, some SPAC sponsors – who typically contribute 3-7% of the listing proceeds upfront to cover underwriting and operating costs – have lost their entire investment because they haven’t been able to conclude a deal. Read More (Financial Times)
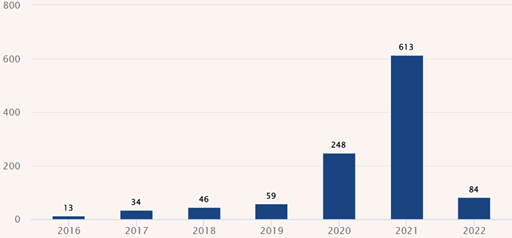
Cryptocurrencies and SPACs implode. 2022 was a terrible year for many global industries. In the financial sector, cryptocurrencies and special purpose acquisition companies incurred the most dramatic nosedive. When introduced, both were promoted as superior alternatives to traditional investments because they are unfettered by government regulation or oversight. But as investors have discovered, a lack of regulation can contribute to massive financial losses. 84 SPAC IPOs occurred in 2022 (70% of the IPO market for the year) compared to 613 in 2021, according to Statista. The performance has been awful, with post-merger companies losing up to 70% of their initial value, quadruple the S&P 500’s losses. Read More (Practical Ecommerce®)
|
Chart 11: Average Announced Valuation of Companies Going Public Through SPACs, Monthly |
|
|
Source: Intro-act, Practical Ecommerce
Zombie companies hook up to survive the startup winter. Will 2023 be the year of corporate zombie marriages? With a recession looming and investors suddenly reluctant to fund companies that don’t make money, I expect cash-strapped private startups, recent tech initial public offerings and former special purpose acquisition companies will try to save their skin by merging with other startups. Coupling with another loss-making young firm might seem an improbable route to salvation. Yet such deals can offer the acquirer a cheap way to increase market share or gain economies of scale; meanwhile the target gets cash to keep the lights on. However, mergers are no substitute for cost-cutting and healthy unit economics – and they won’t fix broken business models. Read More (The Washington Post)
Opportunistic investors are giving up on aging pre-IPO companies. It's a tough time to be a richly priced company that didn't go public when the getting was good. Not only are there fewer later-stage players with the resources and appetite to support such companies – SoftBank and Tiger Global have pulled back dramatically, for example – but even secondary investors have lost interest. Though 40% to 50% of investor interest on the platform at "various points" in 2020 was directed at companies that had been operating for more than 10 years, in recent months, interest in companies that are 10 years or older has dropped to just 8%. That's our reading of a new report by the private securities marketplace Forge. Read More (Yahoo! Finance)
The rise and fall of SPACs – Beppe Jaccarini. Special Purpose Acquisition Companies (SPACs) have seen a significant rise in popularity in recent years, particularly in the U.S. The rise of SPACs can be attributed to several factors. One of the main reasons is the increased market demand for alternative investment opportunities. With the stock market reaching record highs in recent years, many investors have been looking for new ways to diversify their portfolios. Another reason for the rise of SPACs is the increased interest in technology and disruptive start-ups. Many of the companies that have gone public through SPACs in recent years have been technology companies or companies in other high-growth industries. However, there has been a recent slowdown in trajectory in the number of SPACs going public. The main reason for this is that the market has become increasingly saturated with SPACs, leading to a decline in investor interest. Additionally, there have been several high-profile SPACs that have failed to complete acquisitions, leading to negative sentiment towards the structure. Read More (Times Malta)
M&A in 2023: Four actions to win the race for returns. While investment bankers and other M&A specialists disagree on their projections of the M&A landscape in 2023, virtually all boards of directors agree on one thing: They want to see results sooner rather than later. Meeting this expectation falls squarely on the CFO. As the primary internal sponsors of M&A transactions, finance leaders must ensure due diligence efforts are comprehensive enough to satisfy the shortening timelines for returns on acquisition that more boards and investors demand. This means CFOs will need to exercise and emphasize different M&A muscles in 2023 than they have in the past 24 months. The M&A forecast for the next 12 months is decidedly split, nearly evenly so, among two camps: those who expect a brief and shallow downturn in the global economy, and those who project a longer, deeper recession (though still an historically milder slump). The first camp expects M&A activity to accelerate as soon as Q2 while the latter camp expects an increase in dealmaking to arrive closer to Q4. Read More (Forbes)
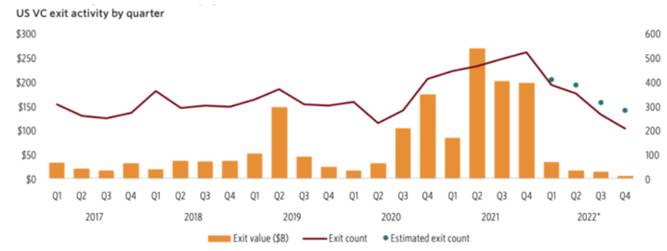
After a big slowdown in IPO and M&A activity, analysts are optimistic for a rebound. After startup exit activity took a nose dive in 2022 amid inflation, rising interest rates, and other macroeconomic forces, some tech analysts are predicting public listing and acquisitions to pick up in the latter half of this year. Speaking at a Silicon Valley Bank event in Seattle, SVB Private Chief Investment Officer Shannon Saccocia said investors will have a “risk appetite increase” in the third and fourth quarters because of the positive returns the public equity markets have produced historically. “Everyone is really excited right now to park their money in 4.5% yielding T-Bills (Treasury Bills),” she said. “Over time, some of that money will be funneled back into risk assets.” This could improve investor sentiment toward equities and growth stocks in the public and private markets, she said. Read More (GeekWire)
|
Chart 12: Exit Activity Declines Sharply to Historic Low |
|
|
Source: Intro-act, GeekWire, Pitchbook
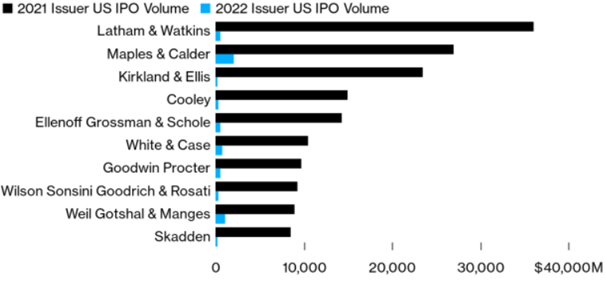
IPO bust sends big law work plummeting 95% from record year. There’s some good news for capital markets lawyers: 2022 is over. It was a dismal 12 months for U.S. initial public offerings, which raised just more than $18 billion last year. That’s down more than 95% from the record $275 billion raised in 2021, propelled by a boom in blank-check companies that have since fallen off the map. Some Big Law practitioners are cautiously optimistic that the market will thaw this year, but nobody’s expecting a return to the boom times. Companies considering a public offering are still grappling with an unpredictable market as the U.S. Federal Reserve continues to raise interest rates to tamp down inflation. In deal count terms, only two firms, Ellenoff Grossman and Loeb & Loeb, advised on more than 10 underwriter-side IPOs last year. Maples & Calder, which specializes as local Cayman Islands counsel for SPAC IPOs, and Loeb & Loeb were the only two firms to advise on more than 10 issuer-side offerings. Read More (Bloomberg Law)
|
Chart 13: The 10 Busiest Firms in 2021 Saw Issuer-Side U.S. IPO Work Dry Up 95% on Average in 2022 |
|
|
Source: Intro-act, Bloomberg Law
IRS issues guidance interpreting stock buyback excise tax, with implications for SPACs. This past August, as part of the Inflation Reduction Act, Congress enacted a 1% excise tax on stock repurchases by certain publicly traded corporations after December 31, 2022. The excise tax applies to any “covered corporation” that “repurchases” its stock. A covered corporation includes any domestic corporation that is traded on an established securities exchange and would therefore typically include any domestic SPAC. Non-U.S. SPACs are generally not subject to the excise tax unless they domesticate prior to the applicable repurchase. The term “repurchase” includes both redemptions of stock and transactions that are determined by the Treasury Secretary (typically in the form of regulations) to be economically similar to redemptions. Read More (Mondaq)
Stock buyback tax looms over SPACs. The new 1% excise tax on share buybacks – effective January 1 – threatens to ding special purpose acquisition companies as the SPAC market has all but dried up. The potential impact of the new 1% stock repurchase excise tax remains a thorny question for financial executives and tax preparers working with special purpose acquisition companies (SPACs). While the Internal Revenue Service (IRS) issued interim guidance just days ahead of the tax going into effect Jan. 1, the 52-page 2023-2 notice was effectively silent on whether SPACs would be subject to the new tax if they redeemed shares instead of going forward with their transaction, tax experts say. “One of the big questions is when the money that is collected by the SPAC is returned to the purchasers of the shares, is that going to generate this tax?” Robert Lickwar, a partner with UHY LLP, an accounting and advisory firm, said in an interview before the guidance was issued. Read More (CFO Dive)
SPACs win small respite under IRS stock-buyback tax guidance. The IRS is giving sponsors of blank-check companies a small bit of relief: They may be getting bludgeoned by the market and regulators alike, but at least many of them won’t have to pay the new stock-buyback tax. Promoters of blank-check companies had feared that SPAC transactions would be subject to the 1% excise tax on stock repurchases that took effect Jan. 1. But guidance the IRS issued in late December indicates that while some SPACs will have to pay the new tax, most will generally be able to avoid it. Read More (Bloomberg Law)
SEC plans to finalize two dozen rules in 2023. The SEC’s most recent update to its rulemaking agenda shows that the commission is planning to finalize 24 proposed rules, the vast majority of them by the spring of 2023. Several involve SPAC oversight. The SEC is proposing to require additional disclosures about SPAC sponsors, conflicts of interest and sources of dilution. The proposal also would require additional information about business combination transactions, including disclosures related to the fairness of the transactions. Read More (Thomson Reuters)
SPAC D&O – The myth of the magic bullet. The recent SPAC boom created many challenges, one of which being the volatility of D&O insurance premiums as SPAC operators face a heightened and evolving litigation environment. The explosion in SPAC transaction volume brought with it an explosion in novel D&O insurance products – products that are, unfortunately, often much riskier than stakeholders suspect. It requires extremely specialized expertise, and both a historical and forward-looking perspective to navigate these situations safely. How did this situation come about? As is often the case with any emerging market or boom, solutions are commonly rushed to market by advisors and businesses seeking to capitalize on the trend, with the market for D&O insurance for SPACs being one such example. Read More (Yahoo! Finance)
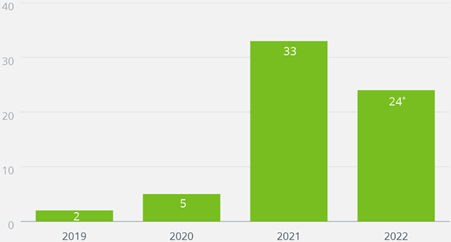
SPAC litigation by the numbers: Surprisingly positive trends in 2022. Tumultuous, exasperating, difficult, nerve-wracking, and frustrating are all apt descriptions of the 2022 SPAC market. In 2021, there were 199 closed transactions, a number that is almost double the 102 de-SPACs that closed in 2022. In 2021, we observed 33 securities class actions (SCAs), which were filed following 2020, a year with only 64 closed de-SPACs. Based on the average time after the merger (nine months) or the SPAC IPO (22 months) that it takes for an SCA to materialize, we were expecting a much higher number of SCAs in 2022. But, in fact, only 24 SCAs were filed in 2022 – a 27% decline from 2021 numbers. What could be causing the decline in the number of SPAC securities class action lawsuits? First is the increased sophistication of SPAC market participants, including SPAC teams and their advisors, over the last two years. Read More (Woodruff-Sawyer & Co.)
|
Chart 14: SPAC/De-SPAC Securities Class Action Filed 2019 to 2022 |
|
|
Source: Intro-act, Woodruff Sawyer *Excludes the three SPACs that were not related to the company’s former business combination with a SPAC
Delaware court of chancery issues two opinions in the SPAC context. In recent weeks, the Delaware Court of Chancery has issued two noteworthy opinions in the special purpose acquisition company (SPAC) context – one related to fiduciary duties and one related to the technical question of when a class or series of stock is entitled to its own separate vote on a charter amendment. These opinions provide valuable insight into how the courts may view common elements of de-SPAC transactions and also have broader implications for practice. Read More (JD Supra)
Lawsuit testing value of SPACs survives motion to dismiss. A court ruling bolstered research that argues the true worth of blank-check company mergers is often far below the typical $10-a-share valuation. The Delaware Chancery Court ruling found that GigCapital3 must face claims that public shareholders were denied crucial information, including how much money shares were worth in the purchase of electric vehicle manufacturer Lightning eMotors. The GigCapital3 SPAC shareholders couldn’t make an informed decision on whether to cash out shares or participate in its purchase of Lightning eMotors, court Vice Chancellor Lori Will ruled. The ruling adds to legal problems facing SPACs and their sponsors, who earn huge payouts when blank-check companies complete mergers. Read More (Bloomberg Law)
SPAC defenders fear professor’s victory means lawsuit gold rush. Stanford Law Professor Michael Klausner’s legal push aimed at showing SPACs are a rip-off for everyday investors is going as well as he could have hoped. And some fear it’s going too well. Klausner and Grant & Eisenhofer lawyers won a ruling allowing their case against a SPAC, GigCapital3 Inc., to move toward trial. The Delaware Chancery Court ruling essentially rubber-stamped Klausner’s conclusions about the murky economics of SPACs. Klausner’s victory is important because his criticisms are applicable, in varying degrees, to every SPAC merger – and there were lots of them. There were 301 completed SPAC mergers in 2021 and 2022, valued at more than $650 billion, according to SPAC Research. Virtually all those companies’ shares have performed poorly post-merger, a factor that would help lawyers calculate potential damages. Among nearly 250 completed SPAC deals as of mid-2022, only four were trading above their initial offering price, according to Valuation Research Corp. Read More (Bloomberg Law)
Fidelity fund bought shares in a Crypto SPAC. The Fidelity Concord Street Trust, which kind of invests in everything with $11 billion in assets under management, has invested in a number of crypto related entities, though not in bitcoin or eth directly. The fund has $4.6 million worth of Coinbase, $1 million worth of MicroStrategy, half a million worth of both the Riot and the Marathon bitcoin miner, and a number of Special Purpose Acquisition Companies (SPACs). That includes the Blockchain Coinvestors Acquisition Corp and the Blockchain Moon Acquisition Corp. at $90,000 and $62,000 respectively. The former is still looking for a blockchain company to take public, while the latter has signed an agreement to acquire all the Web3 assets of DLTx ASA, a Norwegian company. Interestingly the long list of entities bought by this Fidelity fund does not include even one company that has eth or bitcoin in their name, and only one with crypto. Read More (Trustnodes)
Crypto firm Circle blames SEC for collapse of $9 billion SPAC deal. Stablecoin company Circle says the SEC is to blame for its failure to go public. The company told the Financial Times in an interview published that its $9 billion deal was called off last year not because of the turbulent cryptocurrency market, but because the SEC had not approved it. Circle Internet Financial and Concord Acquisition last month terminated their proposed business combination initially announced in July 2021. Shortly thereafter, Concord redeemed shares and dissolved. Read More (Financial Times)
Betty Liu’s SPAC to close as deal hunt fails after holders bail. D & Z Media Acquisition Corp., a blank-check firm co-sponsored by Intercontinental Exchange Inc., plans to close shop, and return the cash it raised to investors after its deal hunt failed. The special-purpose acquisition company’s sponsors said the firm will liquidate after deciding against adding more cash to its holdings to buy additional time to close a deal. The firm expects the payout to be $10.17 per share after it raised $287.5 million in 2021 with an eye to bringing a media, education-technology or related company public. The SPAC was led by Chair and Chief Executive Officer Betty Liu, a media entrepreneur and alum of both the New York Stock Exchange and Bloomberg TV. Intercontinental Exchange and Navigation Capital Partners were co-sponsors, filings show. Read More (Yahoo! Finance)
Start-ups end a bruising 2022, stare down another challenging year. Start-ups had a dismal year by nearly every measurement in 2022, from plummeting investment to scarce public listings, and data point to a 2023 that could be even more difficult. As markets tanked in early 2022, many start-up executives and investors were confident that a record amount of venture capital waiting to be spent – known as dry powder – and a lingering enthusiasm for new tech trends would buffer Silicon Valley. No such luck. As 2022 closed, start-up founders and investors were licking their wounds from plunging investment, scant opportunities to turn equity into cash, layoffs, and business pivots. The start-up industry is now staring down a bleak start to the new year, including signs that valuations have much further to fall, said venture capitalists, bankers, and fund managers. Read More (News Update)
A year after going public via SPAC, E-tailer Boxed mulls potential sale. Strapped for financing, online bulk-products retailer Boxed said it’s exploring a range of strategic options, including a possible sale of the company. New York-based Boxed announced the plan and noted that the company also is “actively exploring capital-raising initiatives” and expects to unveil additional funding within the next 45 days. Investment banks Cowen and Solomon Partners have been retained as financial advisers to help Boxed assess its strategic alternatives. “There are two main points to it. We continue to actively pursue financing and, as we explore capital-raising initiatives, we have a duty to our stockholders to explore all the options available to us. So that includes a potential sale of the company, potentially partnering with other folks, potentially a merger,” Boxed CEO Chieh Huang told Winsight Grocery Business in a phone interview. Read More (Winsight)
SPAC backed by Tiger Woods fails as industry crumbles. Sports & Health Tech Acquisition Corp, the blank-cheque firm backed by professional golfer Tiger Woods, has dropped its plans for a $150 million initial public offering (IPO). The special-purpose acquisition company (SPAC) asked to withdraw its registration for an IPO filing with the US Securities and Exchange Commission (SEC). The firm said last year it was planning to seek a merger target in the sports or health tech sectors with an enterprise value of $600 million to $1billion. The SPAC was set to be led by Andrew White, who is chairman of LeAD Sports Ltd, a sports and health technology business with Christopher Hubman slated to fill the role of finance chief. Hubman has been the chief financial officer of Tiger Woods Ventures since 2000. Read More (The Star)
Planet Labs finance chief says SPAC deal was key to recent growth. Ashley Johnson, CFO for Planet Labs, said the satellite-imaging company made the right call to go public by combining with a SPAC. The Google-backed satellite-imaging company recently raised its revenue expectations for the fiscal year, which ends this month. Planet Labs combined with dMY Technology IV in December 2021, receiving a minimum of $589 million on the deal. The company said last month its revenue jumped 56.8% to $49.7 million for the quarter ended October 31, compared with the prior-year period, and that its quarterly loss narrowed to $40.2 million from $41.5 million a year earlier. Read More (The Wall Street Journal)
Saxo Bank eyes Copenhagen listing after failed SPAC merger. After plans to merge with a blank cheque company last month, CEO Kim Fournais said that Saxo Bank could offer its investors a fresh chance to cash in. Fournais stated that there has been a desire to eventually list Saxo. He also said that the bank is not in a hurry to float, as long as market turmoil continues. He said that Nasdaq Copenhagen would be the most suitable venue for a float. Saxo Bank was valued at €2 billion in September. This could allow Geely , a Chinese automaker, and Sampo, a Finnish insurer, to reduce their stakes. Fournais said that while the broker in Denmark will keep all options open, its default plan is for it to go public. Read More (EU Reporter)
Major life sciences M&A deals on 2023 agenda, says report. The global life sciences mergers and acquisitions (M&A) investment totalled $105 billion in the first 11 months of 2022, with total deal value well down in 2021. However, the research observed this trend shifted as the year closed, with Johnson & Johnson and Amgen both making multibillion dollar acquisitions. EY’s research observed an overall drop in 2022 M&A investment worldwide. It stated this reflects the ongoing economic uncertainties due to geopolitical pressure. In the first 11 months of 2022, biopharma M&A value dropped by 42% compared to 2021, with Pfizer’s acquisition of Biohaven, the single largest deal up to December 2022. Alliances were a significant focus for biopharma and companies’ M&A strategies in 2022. Read More (European Pharmaceutical Review)
Money moves: How the biotech market is weathering inflationary storms. After a tumultuous year that weathered the continued impact of a bear market, many in biotech are looking for signs of improvement in 2023. However, industry experts have buckled up in anticipation of continued challenges this year. While some say that the tide could turn in H2 2023, others are more apprehensive. Lyne compares the current situation to a game of musical chairs, where the status of each company essentially depends on where they were positioned when the market shifted. Consequently, companies were “unlucky” if they were short on funding when the market downturn started, he says. One of the greatest challenges for biotechs is rising interest rates, which are inversely related to their valuations, explains Ryan. Inflation affects net present value (NPV) models used by biotech companies, given that they are a decade away from potential revenue, says Jack O’Meara, CEO of the biotech Ochre Bio. Pierre Socha, partner in the Early-Stage Fund of the VC firm Amadeus Capital Partners, says he views investments in blocks of 5–10 years. Read More (PharmaceuticalTechnology)
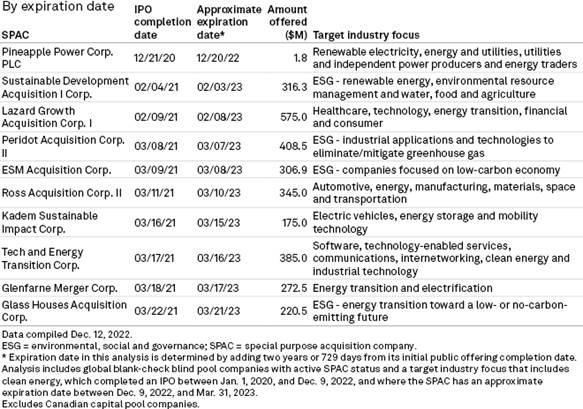
Energy transition investors fighting to defy SPAC stigma. Once the hottest craze on Wall Street, SPACs have endured a fall from grace since the market peaked two years ago, but a few energy transition investors remain determined to succeed against the negative sentiment. Investors use SPACs to bring privately owned, fast-growing start-ups into public markets. The energy transition space has been a key beneficiary of the trend, with companies involved in electric vehicles, nuclear technology, and battery storage among those being targeted. Interest in SPACs exploded in early 2021 but collapsed almost as quickly amid challenging market dynamics. Investors started to come under heightened scrutiny from regulators aimed at closing loopholes that allowed target companies to overstate their financial projections. Many companies have also struggled with stock performance since concluding their SPAC mergers. In a sign of the difficult market dynamics, some SPACs have been forced into liquidation months before their original expiry date, including certain vehicles that include energy among their target sectors. Read More (S&P Global)
|
Chart 15: Active SPACs Nearing Expiration with Clean Energy as Target Sector |
|
|
Source: Intro-act, S&P Global Market Intelligence
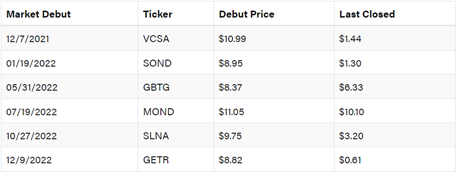
How did all those travel SPACs end up doing? The investor mania for SPACs in the past two years cooled mighty quick, with most travel companies going public through this process plummeting in value since their stock market debuts. In fact, some of the major travel SPACs have lost on average more than 65% of their value from market debut. Despite the disappointing performances of SPACs from the past two years’ hype, travel/mobility tech market intelligence agency TNMT writes that they likely won’t disappear, since the market is only a reflection of whatever that is fashionable. Changes in sponsor appeal from growth to fundamentals and the new macroeconomic climate are leading investors to be on the lookout for different kinds of acquisition targets in the next movement. Read More (Skift)
|
Chart 16: Table Summary of SPAC Performances |
|
|
Source: Intro-act, Skift
Amid economic downturn, space investment plummeted in 2022. Private investment in the space sector declined by 58% in the year 2022, according to a new Space Investment Quarterly report from the firm Space Capital. The $20.1 billion in private market equity investment last year is the lowest annual total since 2015, said Chad Anderson, the founder and managing partner of Space Capital. While early-stage investments were largely unchanged, a large decline came in late- and growth-stage companies. The report cites several factors for the pullback, including the fastest interest rate hike cycle since 1988, a challenging investment environment, and a continued economic recovery from the COVID-19 pandemic. However, Anderson told Ars that another factor was the relatively poor returns of space-based companies that have gone public via the SPAC process. Read More (Ars Technica Addendum)
Buckle up, it could get bumpy: The space economy’s vaunted resilience will be tested in 2023. While gloomy economic forecasts spell trouble for early-stage space firms in 2023, analysts say the industry as a whole should largely prove resilient to any downturn. Space businesses are more agile than ever in responding to changing market conditions, and governments worldwide are expected to continue underpinning growth for many of them, even as private funding sources dry up. However, even those able to weather harsh financial climates will face operational challenges and dampened growth prospects this year. 2022 was marred by economic uncertainty. Soaring inflation, supply chain disruption, energy price hikes, and other headwinds contributed to an unstable and uneven recovery for markets still battling the lingering effects of COVID-19. And forecasters are painting another year of uncertainty for 2023 as the pandemic and ongoing war in Ukraine cloud the outlook. Read More (SpaceNews)
January’s FinTech SPAC freeze reflects widespread chill on Wall Street. The special purpose acquisition company (SPAC) may not be dead, but its pulse is pretty faint. January has thrown a deep chill for public listings in the FinTech space and has so far been a complete freeze-out for SPACs, which were once the darlings of Wall Street. As tracked by PYMNTS, and with data current, we see only a couple of listings announcements year to date – and they are all being done through “traditional” initial public offerings (IPOs), with not a single SPAC among them. The data shows that January’s pace is a steep fall from even the month before. There are a number of factors at work here. The latest spate of economic data shows that retail spending remains on the decline for the second straight month. And inflation remains high, even if its pace has been a bit muted. Read More (PYMNTS)
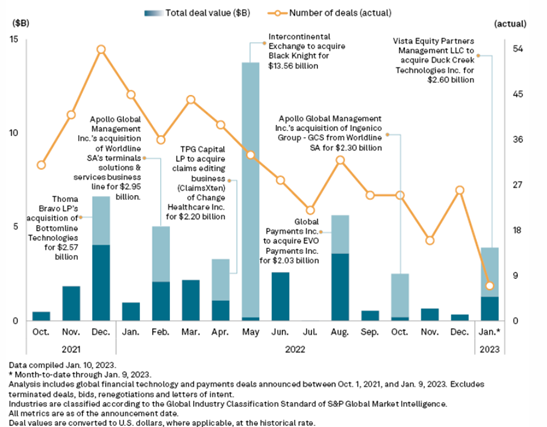
Fintech M&A Deal Tracker: Buyers looking to scoop up public targets on the cheap. The slashed valuations of some publicly traded financial technology companies will continue to prompt M&A interest from strategic and private equity buyers. Many fintech companies went public with lofty valuations during the latest peak around 2021 only to see their share prices plummet in 2022. With a similar valuation trend, BTRS Holdings Inc., a payment technology company doing business as Billtrust, was acquired by EQT Partners Inc. in December 2022 for $1.7 billion. Billtrust, which went public in 2021 via a merger with special purpose acquisition company South Mountain Merger Corp., sold to EQT at $9.50 per share after its stock topped $19 per share in 2021, and the company sold shares at $12.25 per share in a follow-on offering that same year. Read More (S&P Global)
|
Chart 17: Fintech and Payments M&A Deals Announced Since October 2021 |
|
|
Source: Intro-act, S&P Global Market Intelligence
Moolec Science Ltd. (MLEC) and LightJump Acquisition Corp. complete business combination. Moolec Science Ltd., a science-based food ingredient company focused on producing animal proteins in plants through Molecular Farming, and LightJump Acquisition Corp., a publicly traded special purpose acquisition company, have completed their business combination. Pursuant to the transactions contemplated by the business combination agreement, Moolec UK and LightJump became wholly owned subsidiaries of Moolec Science SA, a Luxembourg company incorporated for the purposes of the business combination. Beginning January 3, 2023, Moolec Science’s ordinary shares and warrants started trading on the Nasdaq Capital Market under the ticker symbols "MLEC” and “MLECW”, respectively. Read More (Globe Newswire)
Tiedemann Group and Alvarium Investments (ALTI) and Cartesian Growth Corp. complete business combination. Tiedemann Group, Alvarium Investments Limited, and Cartesian Growth Corporation (NASDAQ: GLBL) have completed their business combination. The Business Combination was approved at an extraordinary general meeting of stockholders of Cartesian on November 17, 2022 and closed on January 3, 2023. The combined company now operates as Alvarium Tiedemann Holdings, Inc. and its Class A common shares and warrants starts trading on NASDAQ under the ticker symbols “ALTI” and “ALTIW," respectively, starting January 4, 2023. Alvarium Tiedemann is a leading independent global wealth and asset manager providing entrepreneurs, multi-generational families, institutions, and emerging next-generation leaders with fiduciary capabilities as well as alternative investment strategies and advisory services. Read More (Business Wire)
MultiMetaVerse Inc. (MMV) and Model Performance Acquisition Corp. complete business combination. MultiMetaVerse Inc., an animation and entertainment company devoted to establishing an open community for its global users and to providing high-quality and immersive entertainment experiences, and Model Performance Acquisition Corp., a special purpose acquisition company, completed their business combination. The listed company resulting from the Business Combination is MultiMetaVerse Holdings Limited. On January 5, 2023, MMV's shares started trading on the Nasdaq Global Market under the ticker symbol "MMV," and MMV's warrants started trading on the Nasdaq Capital Market under the ticker symbol "MMVWW." MMV is an animation and entertainment company devoted to establish an open community for its global users comprised of animation viewers, game players, and content creators and to provide high-quality and immersive entertainment experience by way of original contents, user-generated contents, and professional user-generated contents. Read More (PR Newswire)
Bridger Aerospace Group Holdings, LLC (BAER) and Jack Creek Investment Corp. complete business combination. Bridger Aerospace Group Holdings, LLC, a leading independent provider of aerial firefighting services, and Jack Creek Investment Corp., a special purpose acquisition company, completed their business combination. The combined company operates as “Bridger Aerospace Group Holdings, Inc.” and its common stock and warrants started trading on the Nasdaq Global Market under the ticker symbols “BAER” and “BAERW,” respectively, on January 25, 2023. The Business Combination was approved at a special meeting of Jack Creek shareholders on January 24, 2023. Founded in 2014 and led by former Navy SEAL Tim Sheehy, Bridger is a mission-driven company focused on addressing the year-round threat of economic and environmental damage caused by wildfires. Read More (Globe Newswire)
Freightos Limited (CRGO) and Gesher I Acquisition Corp. complete business combination. Freightos Limited (Nasdaq: CRGO), a leading global freight booking, and payment platform closed its business combination with Gesher I Acquisition Corp., a special purpose acquisition company. The combined company will operate as Freightos Limited. Ordinary shares and warrants of Freightos started trading tomorrow on the Nasdaq under the ticker symbols "CRGO" and "CRGOW", respectively. Freightos connects key participants across the global freight ecosystem, including hundreds of airlines, ocean liners, and trucking companies, thousands of freight forwarders and over 10 thousand importers/exporters, through a transparent digital platform that allows real-time global freight rate comparison, booking, payment, and shipment management. Read More (PR Newswire)
Orchestra BioMed, Inc. (OBIO) and Health Sciences Acquisitions Corp. 2 complete business combination. Orchestra BioMed, Inc., a biomedical company accelerating high-impact technologies to patients through risk-reward sharing partnerships, closed its business combination with Health Sciences Acquisitions Corp. 2. Common stock of the combined company, which is called “Orchestra BioMed Holdings, Inc.”, started trading on January 27, 2023, on the Nasdaq Global Market under the ticker symbol “OBIO”. Orchestra BioMed’s management team, led by Chairman, Chief Executive Officer, and Co-founder David Hochman, will lead the combined company. The business combination, which had previously been approved by Orchestra BioMed stockholders, was approved by HSAC2 shareholders at a special general meeting held on January 24, 2023. Read More (Globe Newswire)
DTRT Health Acquisition will liquidate after terminating the Consumer Direct deal. DTRT Health Acquisition in an 8-K filing said Consumer Direct Holdings had terminated a merger agreement with the SPAC. As a result, DTRT’s sponsor resolved to make no further contributions to SPAC’s trust for deadline extensions. Without those deposits, DTRT said in the filing it is thus obligated to liquidate and redeem shares as soon as practicable. The notice terminates the merger agreement as of Jan. 11. Announced in September the transaction implied an enterprise valuation for the target of $681 million. Based in Missoula, Montana, Consumer Direct is a national in-home personal care provider offering in-home care assistance and customer service to older adults and people with disabilities who require long-term care and support with activities of daily living. Read More (SEC)
FoxWayne Acquisition Corp. (FOXW) terminates Clover deal. FoxWayne Acquisition Corporation (NASDAQ: FOXW) announced in an 8-K that it has mutually terminated its combination agreement with dating app developer Clover. Although the SPAC did not disclose why the parties nixed the deal, the termination comes just a day after the company held its extension vote. FoxWayne is facing a completion deadline of January 22, but is hoping to gain shareholder approval to extend its timeline by three months to April 22, and then extend another three months to July 22 without another vote. While FoxWayne initially raised $58.1 million through its IPO in January 2021, it currently has approximately $13.7 million held in trust. The SPAC saw 76.63% of its trust redeemed at a vote held in July 2022 when holders of 4,406,322 shares chose to redeem. Read More (SPAC Insider)
New Olympique Lyonnais owners plan SPAC listing. The new owners of French football team Olympique Lyonnais plan to float their multi-club business in the U.S. this year via a SPAC, targeting a $1.2 billion valuation in what would be a first for the football industry. Eagle Football Holdings, the multi-club group controlled by US businessman John Textor, completed the takeover of French top-flight outfit Lyon last month and already own Brazilian side Botafogo and Belgian second-tier club RWD Molenbeek. The group also has a 40% stake in Premier League team Crystal Palace. Eagle Football reportedly wants to go public this year. Timing will be determined by market conditions. Read More (Financial Times)
Hambro perks SPAC eyes merger with Biotech Istesso. Hambro Perks Acquisition Co., the first blank-check firm to list in London after a rule change, is discussing a possible merger with closely held pharmaceutical company Istesso Ltd., Sky News reported. The special purpose acquisition company is in advanced talks on a deal that may value the UK developer of drugs for chronic diseases at several hundred million pounds, according to the report. Istesso, owned by private equity firm IP Group, began mid-stage tests on an experimental rheumatoid arthritis drug dubbed MBS2320 last August, IP said at the time. The company was awarded a so-called orphan drug designation qualifying it for an expedited review by the US Food and Drug Administration in December. Read More (Bloomberg)
SPAC Onyx I in merger talks with Africa-focused energy transition firm Helios. SPAC Onyx Acquisition Corp. I (NASDAQ: ONYX) said that it is in advanced merger talks with Helios Investment Partners to create a publicly traded energy transition platform focused on developing natural gas and low-carbon businesses in Africa. Onyx said the proposed deal will likely value Helios at an enterprise value of around $1 billion. The merger is expected to close during the second half of 2023, but a definitive agreement has yet to be signed. Helios's portfolio includes assets and businesses in Africa aimed at displacing coal and liquid fuel in target areas with natural gas. It’s also developing a pipeline of low-carbon hydrogen-based fuel and renewable/low-carbon power projects. Read More (Seeking Alpha)
|
Chart 18: SPAC Events – February 2023 (1/2) |
|
S. No |
Event Name |
Date |
Time |
|
1 |
PRPC Deadline extension vote |
2/1/2023 |
9AM EST |
|
2 |
JWSM Deadline extension vote |
2/1/2023 |
10AM EST |
|
3 |
AMCI & LanzaTech NZ Merger Vote |
2/6/2023 |
3PM EST |
|
4 |
SDAC Deadline extension vote |
2/1/2023 |
12PM EST |
|
5 |
SZZL Deadline extension vote |
2/1/2023 |
4PM EST |
|
6 |
ASCA Deadline extension vote |
2/2/2023 |
9:30AM EST |
|
7 |
AAC Deadline extension vote |
2/2/2023 |
9:30AM EST |
|
8 |
KRNL Deadline extension vote |
2/3/2023 |
10AM EST |
|
9 |
ATAK Deadline extension vote |
2/3/2023 |
11AM EST |
|
10 |
AEHA & Ocean Biomedical Merger Vote |
2/3/2023 |
10AM EST |
|
11 |
MPRA Deadline extension vote |
2/3/2023 |
11AM EST |
|
12 |
VHAQ & Suneva Merger Vote |
2/3/2023 |
12AM EST |
|
13 |
LGST Deadline extension vote |
2/3/2023 |
4PM EST |
|
14 |
MCAA Deadline extension vote |
2/6/2023 |
10AM EST |
|
15 |
QFTA Deadline extension vote |
2/6/2023 |
11AM EST |
|
16 |
PMGM Deadline extension vote |
2/6/2023 |
12PM EST |
|
17 |
AMCI & LanzaTech NZ Merger Vote |
2/6/2023 |
3PM EST |
|
18 |
MACA Deadline extension vote |
2/7/2023 |
9AM EST |
|
19 |
HHLA Deadline extension vote |
2/7/2023 |
9:30AM EST |
|
20 |
PUCK Deadline extension vote |
2/7/2023 |
10AM EST |
|
21 |
MCAE & ETAO International Merger Vote |
2/7/2023 |
10:30AM EST |
|
22 |
CPTK Deadline extension vote |
2/7/2023 |
11AM EST |
|
23 |
WQGA Deadline extension vote |
2/8/2023 |
9AM EST |
|
24 |
ACAC Deadline extension vote |
2/8/2023 |
9AM EST |
|
25 |
IQMD Deadline extension vote |
2/8/2023 |
9:30AM EST |
|
26 |
PFDR & Movella Merger Vote |
2/8/2023 |
10AM EST |
|
27 |
IRRX Deadline extension vote |
2/8/2023 |
10AM EST |
|
28 |
IPAX & Intuitive Machines Merger Vote |
2/8/2023 |
11AM EST |
|
29 |
ANZU Deadline extension vote |
2/9/2023 |
10AM EST |
|
30 |
ADOC Deadline extension vote |
2/9/2023 |
10AM EST |
|
31 |
NVSA Deadline extension vote |
2/10/2023 |
10AM EST |
|
32 |
SGII Deadline extension vote |
2/13/2023 |
9:30AM EST |
|
33 |
GENQ Deadline extension vote |
2/14/2023 |
9AM EST |
Source: Intro-act, SPAC Track, Boardroom Alpha
Chart 18: SPAC Events – February 2023 (2/2)
|
S. No |
Event Name |
Date |
Time |
|
34 |
AXAC Deadline extension vote |
2/14/2023 |
10AM EST |
|
35 |
DISA Deadline extension vote |
2/14/2023 |
11AM EST |
|
36 |
IFIN Deadline extension vote |
2/14/2023 |
10AM EST |
|
37 |
CHAA Deadline extension vote |
2/14/2023 |
10AM EST |
|
38 |
LGTO & Southland Holdings Merger Vote |
2/14/2023 |
10AM EST |
|
39 |
FTAA Deadline extension vote |
2/15/2023 |
11AM EST |
|
40 |
CCAI Deadline extension vote |
2/15/2023 |
11:30AM EST |
|
41 |
LFAC vote to increase monthly extension payment |
2/15/2023 |
1PM EST |
|
42 |
ALOR Deadline extension vote |
2/17/2023 |
9AM EST |
|
43 |
TLGY Deadline extension vote |
2/17/2023 |
10AM EST |
|
44 |
PFDR Deadline extension vote |
2/17/2023 |
10AM EST |
|
45 |
KAII Deadline extension vote |
2/20/2023 |
10AM EST |
|
46 |
FSRX Deadline extension vote |
2/20/2023 |
11AM EST |
|
47 |
SLAM Deadline extension vote |
2/21/2023 |
9AM EST |
|
48 |
TWNI Deadline extension vote |
2/21/2023 |
9AM EST |
|
49 |
TPBA & Lavoro Merger Vote |
2/22/2023 |
10AM EST |
|
50 |
SWSS Deadline extension vote |
2/23/2023 |
11AM EST |
|
51 |
CMCA Deadline extension vote |
2/24/2023 |
10AM EST |
|
52 |
FSNB Deadline extension vote |
2/24/2023 |
11AM EST |
|
53 |
HPX & Ambipar Emergency Response Merger Vote |
2/28/2023 |
9AM EST |
|
54 |
EBAC & Oculis Merger Vote |
2/8/2023 |
9AM EST |
Source: Intro-act, SPAC Track, Boardroom Alpha
|
Chart 19: SPAC Activity by Month |
|
|
Source: Intro-act, Boardroom Alpha
|
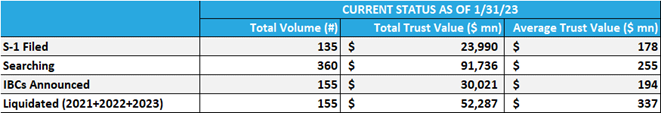
Chart 20: Current Status of the SPAC Universe |
|
|
Source: Intro-act, Boardroom Alpha
|
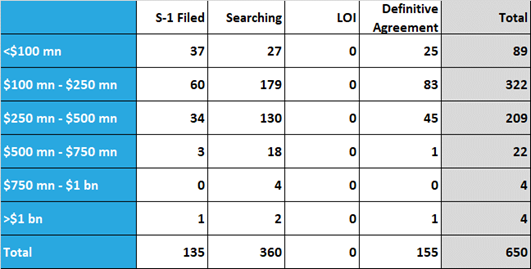
Chart 21: Current Status of SPAC Universe by Trust Size |
|
|
Source: Intro-act, Boardroom Alpha
|
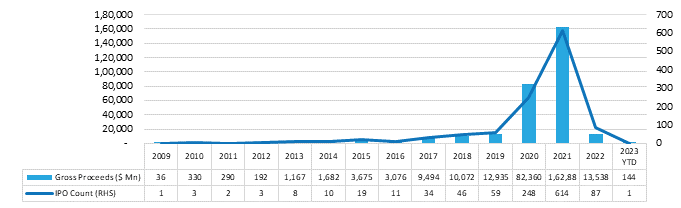
Chart 22: SPAC Transactions by Year |
|
|
Source: Intro-act, Boardroom Alpha
|
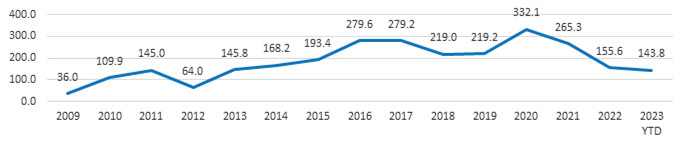
Chart 23: Average SPAC IPO Size ($ Mn) |
|
|
Source: Intro-act, Boardroom Alpha
|
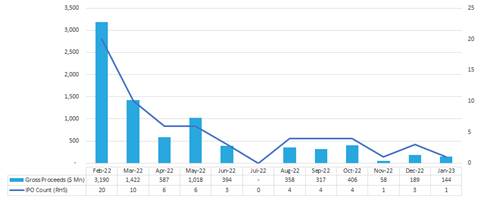
Chart 24: SPAC Transactions by Month (LTM) |
|
|
Source: Intro-act, Boardroom Alpha
|
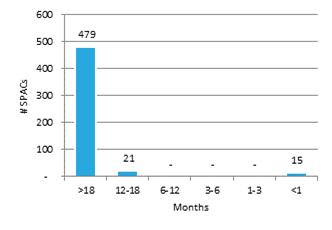
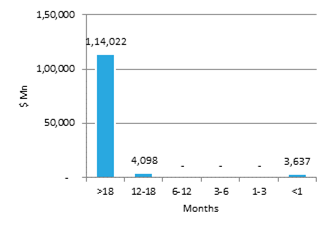
Chart 25: Time to Liquidation – By Volume |
|
Chart 26: Time to Liquidation – By Trust Value |
|
|
|
|
Source: Intro-act, Boardroom Alpha
|
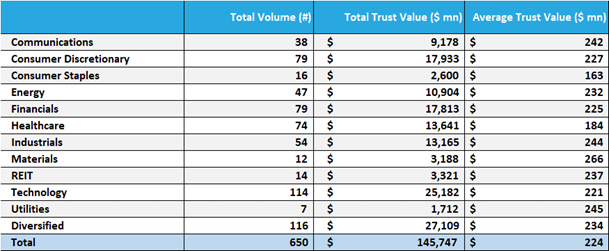
Chart 27: Active SPACs By Sector (As of Month Ending January 2023) |
|
|
Source: Intro-act, Boardroom Alpha
|
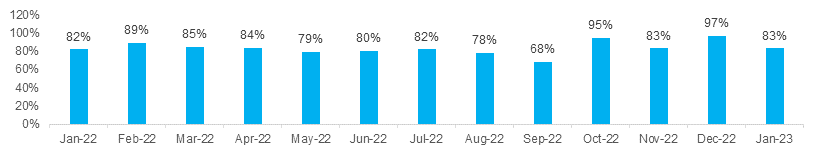
Chart 28: Average Redemption Rate by Month |
|
|
Source: Intro-act, Boardroom Alpha
|
Chart 29: SPAC Redemption Detail – January 2023 |
||||||||||||||||||||||||||||||||||||||||||||||||||||||||||||
|
Source: Intro-act, Boardroom Alpha
|
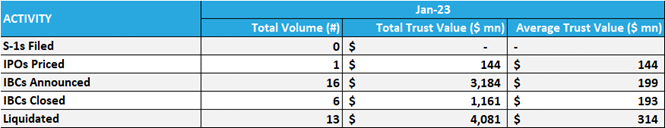
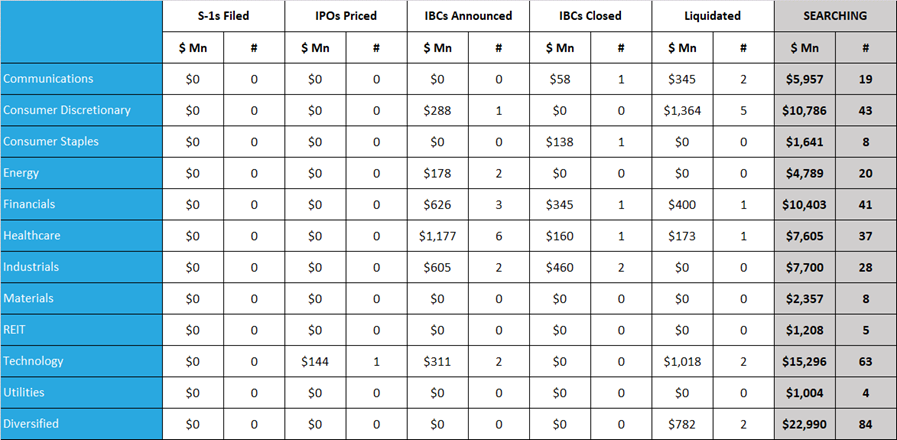
Chart 30: Monthly SPAC Activity – January 2023 |
|
|
Source: Intro-act, Boardroom Alpha. Searching figures ($Mn and Count) are as of month end.
|
Chart 31: SPAC IBC Announcements by Target Sector – January 2023 (1/2) |
||||||||||||||||||||||||||||||||||||||||||||||||||||||||||||||||||||||||
|
Source: Intro-act, Boardroom Alpha
|
Chart 31: SPAC IBC Announcements by Target Sector – January 2023 (2/2) |
||||||||||||||||||||||||||||||||||||||||||||||||||||||||||||||||||||||||
|
Source: Intro-act, Boardroom Alpha
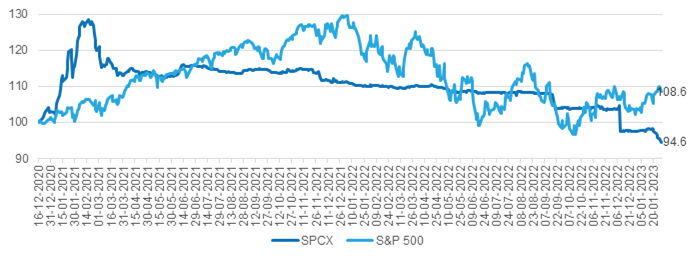
The SPAC and New Issue ETF (SPCX). SPCX gives investors exposure to a broad portfolio of SPACs with the familiar attributes of an exchange traded fund’s diversity, tax efficiency and liquidity. SPCX is the first actively managed SPAC ETF. Why active? As the SPAC market is rapidly evolving, we believe that the portfolio management approach should equally reflect the dynamic nature of this burgeoning capital-raising alternative. This is no place for a rigid rules-based index strategy.
|
Chart 32: SPCX Summary Data |
|
Chart 33: SPCX Top 10 Holdings |
||||||||||||||||||||||||||||||||||||||||||||||||
|
|
|
||||||||||||||||||||||||||||||||||||||||||||||||
Source: Intro-act, ETF.com. Data as of 1/31/23.
|
Chart 34: SPCX Performance |
|
|
Source: Intro-act, Yahoo! Finance. Data as of 1/31/23.
|
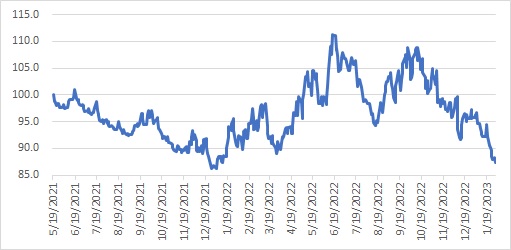
Chart 35: Relative-SPAC Index vs Russell 3000 |
|
|
Source: Intro-act, FactSet
|
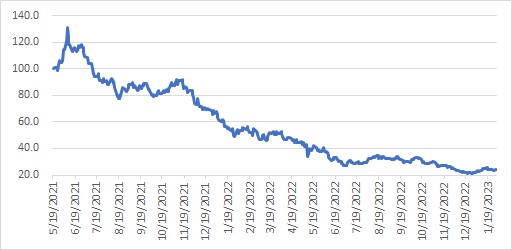
Chart 36: Relative-IBC Index vs Russell 3000 |
|
|
Source: Intro-act, FactSet
|
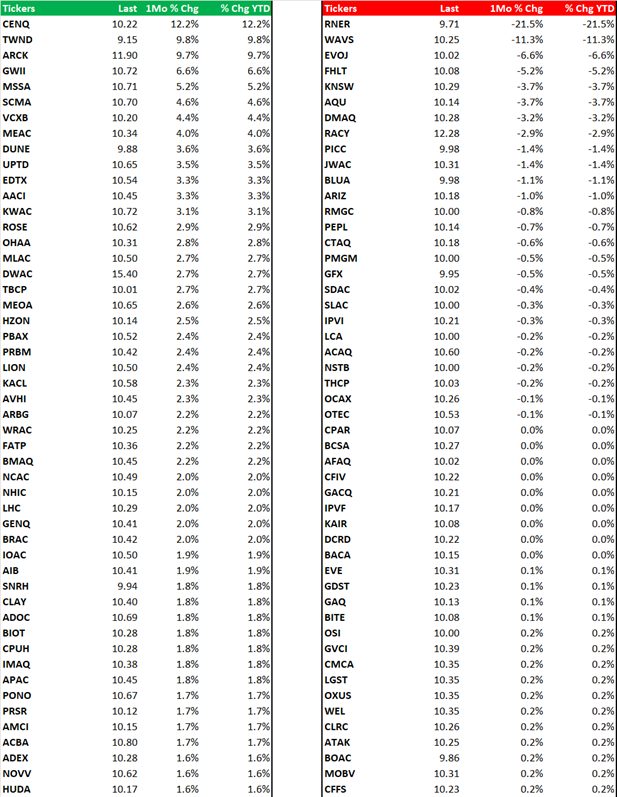
Chart 37: Gainers and Losers in the Broader SPAC Universe (% Change) |
|
|
Source: Intro-act, FactSet
|
Chart 38: SPAC IPO Pricings by Sector – January 2023 |
||||||||||||||||||||||
|
Source: Intro-act, Boardroom Alpha
|
Chart 39: SPAC Institutional Owners League (Current) |
||||||||||||||||||||||||||||||||||||||||||||||||||||||||||||||||||||||||||||||||||||||||||||||||||||||||||||||||||||||||||||||||||||||||||||||||||||||||||||||||||||||||
|
Source: Intro-act, 13F Filings
|
Chart 40: DE-SPAC Institutional Owners League (Current) |
||||||||||||||||||||||||||||||||||||||||||||||||||||||||||||||||||||||||||||||||||||||||||||||||||||||||||||||||||||||||||||||||||||||||||||||||||||||||||||||||||||||||
|
Source: Intro-act, 13F Filings
|
Chart 41: SPAC Underwriter League (YTD As of January 2023 End) |
|||||||||||||||||||||||||||||||||||
|
Source: Intro-act, SPAC Research. Note: Credit for Bookrunner Volume ($ Mn) is based on the total amount of the offering sold, including over-allotment. Full credit is awarded to the sole book-runner or split equally among joint book-runners.
|
Chart 42: Top De-SPAC Advisors (YTD As of January 2023 End) |
||||||||||||||||||||||||||||||||||||||||||||||||
|
Source: Intro-act, SPAC Research. Note: Advisor credit is shared equally among all advisors on a given deal, as a proportion of the enterprise value of the target company acquired by the SPAC. Firms with multiple advisory roles receive credit for each role.
|
Chart 43: SPAC Legal League (YTD As of January 2023 End) |
||||||||||||||||||||||||||||
|
Source: Intro-act, SPAC Research. Note: Credit for Volume ($ Mn) is awarded to both Issuer and Underwriter Counsel.
|
Chart 44: SPAC Auditor League (YTD As of January 2023 End) |
||||||||||||||||||
|
Source: Intro-act, SPAC Research
|
Chart 45: ICR – The Leading SPAC Communications and Capital Markets Advisor |
|
113 Transactions / $267 Billion in Transaction Value Since 2021
|
Source: Intro-act, ICR. Announced SPAC transactions since 2021, All Announcements not shown. Data as of April 2022.
Analyst Certification
I, Peter Wright, certify that the views expressed in the research report accurately reflect my personal views about the subject securities or issues. I also do not receive direct or indirect compensation based on my recommendations or views.
Intro-act, Inc. (Intro-act) issued this report and may seek fees for the assistance with investor targeting, access, and further investor preparation services. Intro-act, Inc. will not seek renumeration for any investment banking service or investment advice.
Accuracy of content: All information used in the publication of this report has been compiled from publicly available sources who are believed to be reliable. However, the issuer and related parties, as well as Intro-act, do not guarantee the accuracy or completeness of this report, and have not sought for this information to be independently verified. Opinions contained in this report represent those of the Intro-act analysts at the time of publication. Forward-looking information or statements in this report contain information that is based on assumptions, forecasts of future results, and estimates of amounts not yet determinable, and therefore involve known and unknown risks, uncertainties, and other factors that may cause the actual results, performance, or achievements of their subject matter to be materially different from current expectations.
Exclusion of Liability: To the fullest extent allowed by law, Intro-act, Inc. shall not be liable for any direct, indirect, or consequential losses, loss of profits, damages, or costs or expenses incurred or suffered by you arising out or in connection with the access to, use of, or reliance on any information contained in this note.
No personalized advice: The information that we provide should not be construed in any manner whatsoever as personalized advice. Also, the information provided by us should not be construed by any subscriber or prospective subscriber as Intro-act’s solicitation to affect, or attempt to affect, any transaction in a security. The securities described in the report may not be eligible for sale in all jurisdictions or to certain categories of investors.
Investment in securities mentioned: Intro-act has a restrictive policy relating to personal dealing and conflicts of interest. Intro-act, Inc. does not conduct any investment business and, accordingly, does not itself hold any positions in the securities mentioned in this report. However, the respective directors, officers, employees, and contractors of Intro-act may have a position in any or related securities mentioned in this report, subject to Intro-act’s policies on personal dealing and conflicts of interest.
Copyright: Copyright 2023 Intro-act, Inc. (Intro-act).
Intro-act is not registered as an investment adviser with the Securities and Exchange Commission. Intro-act relies upon the “publishers’ exclusion” from the definition of investment adviser under Section 202(a) (11) of the Investment Advisers Act of 1940 and corresponding state securities laws. This report is a bona fide publication of general and regular circulation offering impersonal investment-related advice, not tailored to a specific investment portfolio or the needs of current and/or prospective subscribers. As such, Intro-act does not offer or provide personal advice, and the research provided is for informational purposes only. No mention of a particular security in this report constitutes a recommendation to buy, sell, or hold that or any security, or that any particular security, portfolio of securities, transaction, or investment strategy is suitable for any specific person.